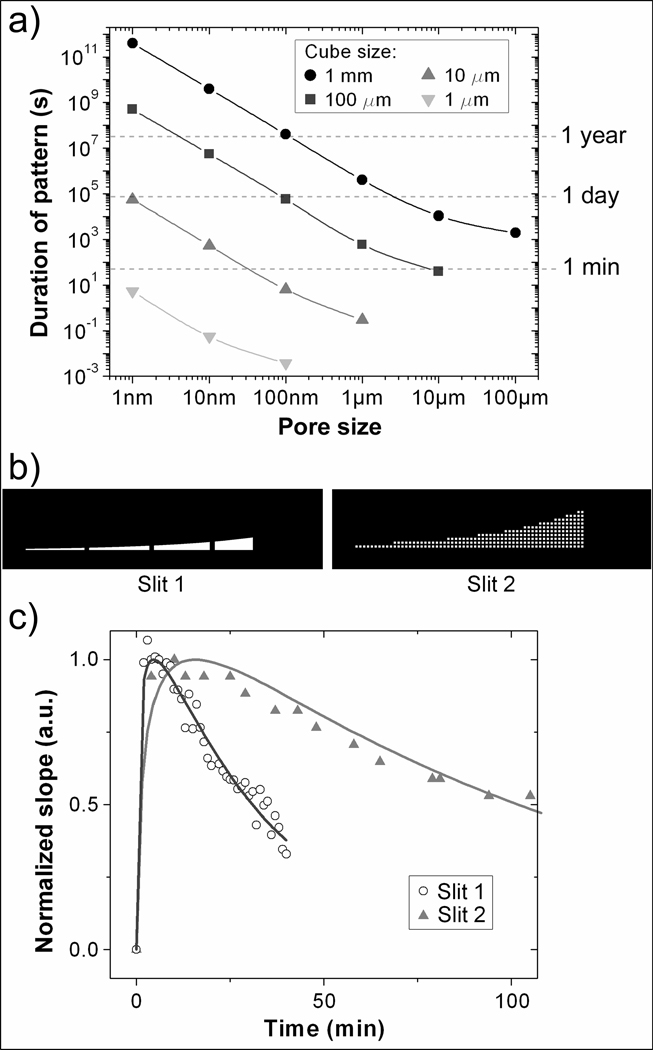
Figure 5. Numerical and experimental results showing temporal control over the chemical patterns.
a) Calculated chemical release times for cubic containers with varying cube and pore size releasing a chemical with D=4.2×10⁻¹⁰ m2/s. The data points plotted correspond to the period at which at least 90% of the maximal concentration is maintained at a distance d away from the center of the container. b) Schematic of two panels with slits which have a similar geometric pattern but with different individual pore size and porosity. c) Experimental (dots) and simulation (solid lines) data showing that duration for a linear spatial gradient is extended by roughly a factor of three for containers with slit 2 as compared to slit 1.

