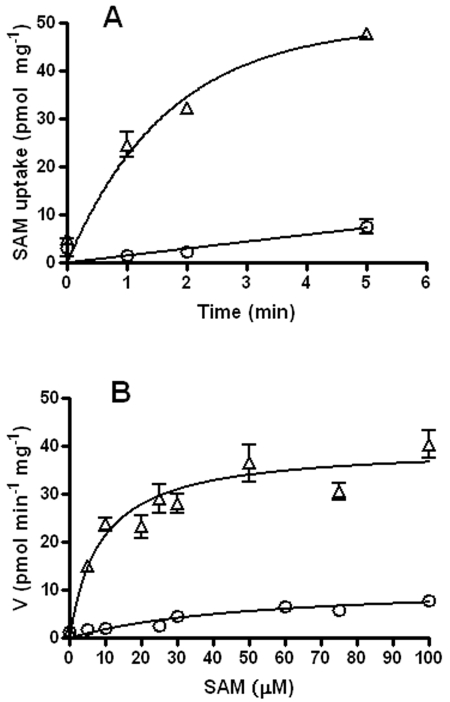
FIG 2 .
Kinetics of SAM transport in E. coli. (A) Time course of [14C]SAM uptake in E. coli at 37°C as a function of time. The time course assay was carried out in transport buffer supplemented with 10 µM [14C]SAM. Time point assays were done in triplicate. (B) Effect of substrate concentration on [14C]SAM uptake at 37°C. The data represent six independent experiments done in triplicate. The background transport seen with MG1655 (○) was subtracted from the transport seen with ATM915 (MG1655 expressing ctl843 [Δ]) with GraphPad Prism software, and then nonlinear regression analysis was performed to obtain the Km and Vmax values.

