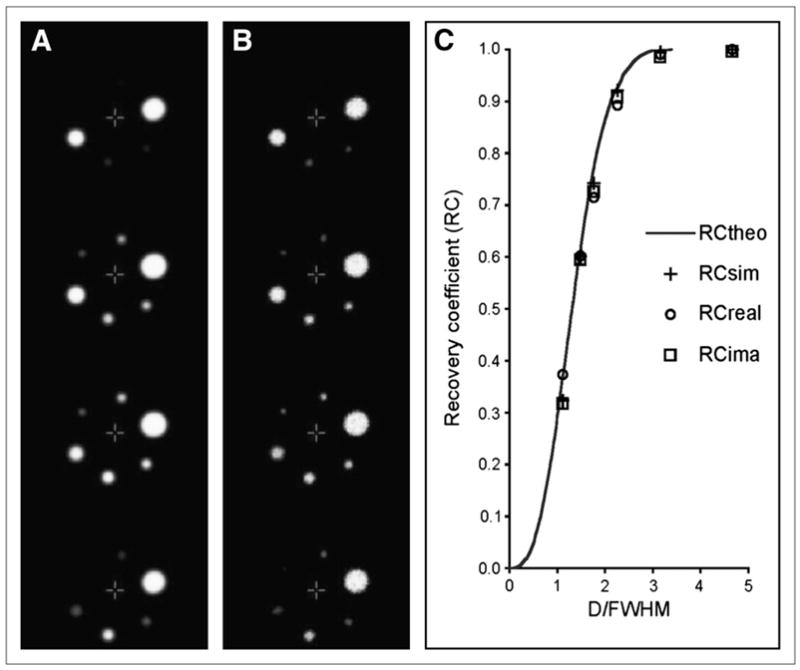
FIGURE 2.

Slice-by-slice comparison of PET images of sphere phantom obtained by projection-based simulation (A) and in the case of real data (B) and RC curves for spheric objects (C) as function of their diameter D normalized to equivalent resolution (FWHM, 7.5 mm) of scanner. Peak values (maximum RC) are for real PET sphere images (open circles) and those generated with projection-based simulator (crosses) and by means of image-based convolution (squares), whereas solid curve represents theoretic RC curve given gaussian PSF of FWHM of 7.5 mm.
