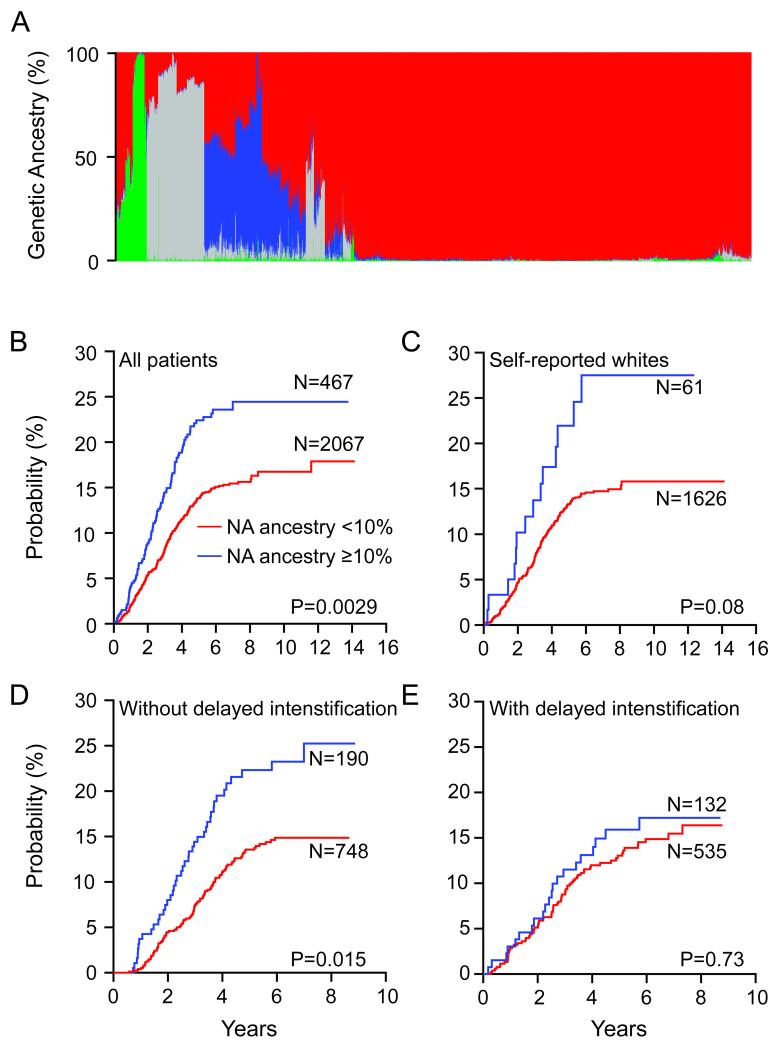
Figure 2. Genetic Ancestry and Risk of Relapse in Childhood ALL.
A. Genetic ancestral composition of 2,534 children with ALL. Each patient’s ancestry is depicted as a column, whereas color represents the proportion of ancestry estimated for that patient (European, red; African, gray; Asian, green; Native American [NA], blue). Genetic ancestry was estimated using STRUCTURE. Patients were clustered using Ward clustering method, based on dissimilarity in genetic ancestry measured by 1-minus pair-wise correlation (see Supplementary Note). Higher levels of NA ancestry were linked to increased risk of relapse in all patients (B), and within the self-reported whites (C), and for those who did not receive delayed intensification (D), but not within those who did receive delayed intensification in the COG P9904/9905 trial (E). Although cumulative incidence of relapse is plotted separately for patients with <10% (red) vs ≥10% (blue) NA ancestry, all P values were estimated using Fine and Gray’s cumulative incidence hazard regression model treating NA ancestry as a continuous variable (see Supplementary Note for details on NA ancestry dichotomization).

