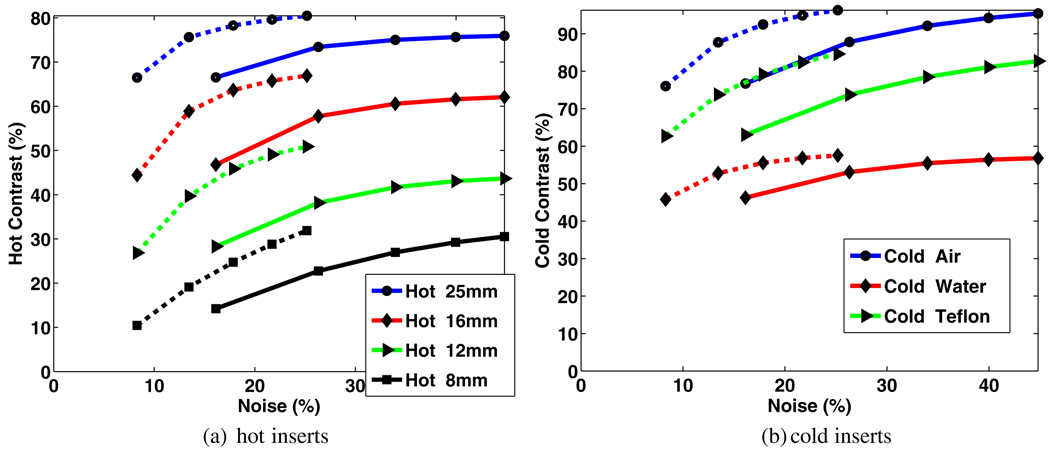
Figure 11.
Comparison of percent contrast versus noise trade-off curves for the four hot and three cold inserts, for standard (solid) and proposed resolution-modeled (dotted) reconstructions (the trade-off curves were generated by increasing the number of iterations from 1 to 5, thus having five points in each curve).

