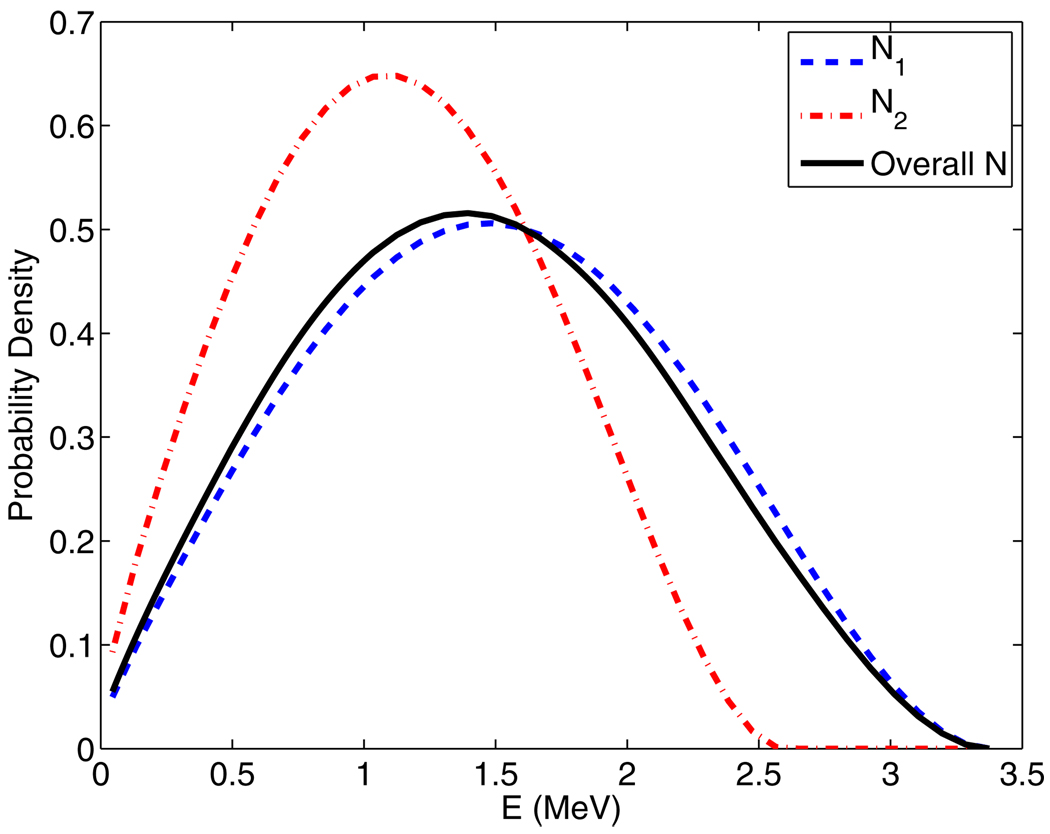
Figure 2.
Plots of Rb-82 positron energy spectrum contributions N1 and N2, which have end point energies of with branching ratios of 0.833 and 0.117, respectively, as well as the overall combined energy spectrum. All curves in the figure have already been normalized to unit area. The overall spectrum is considerably more similar to N1 because of the associated large branching ratio of 0.833.

