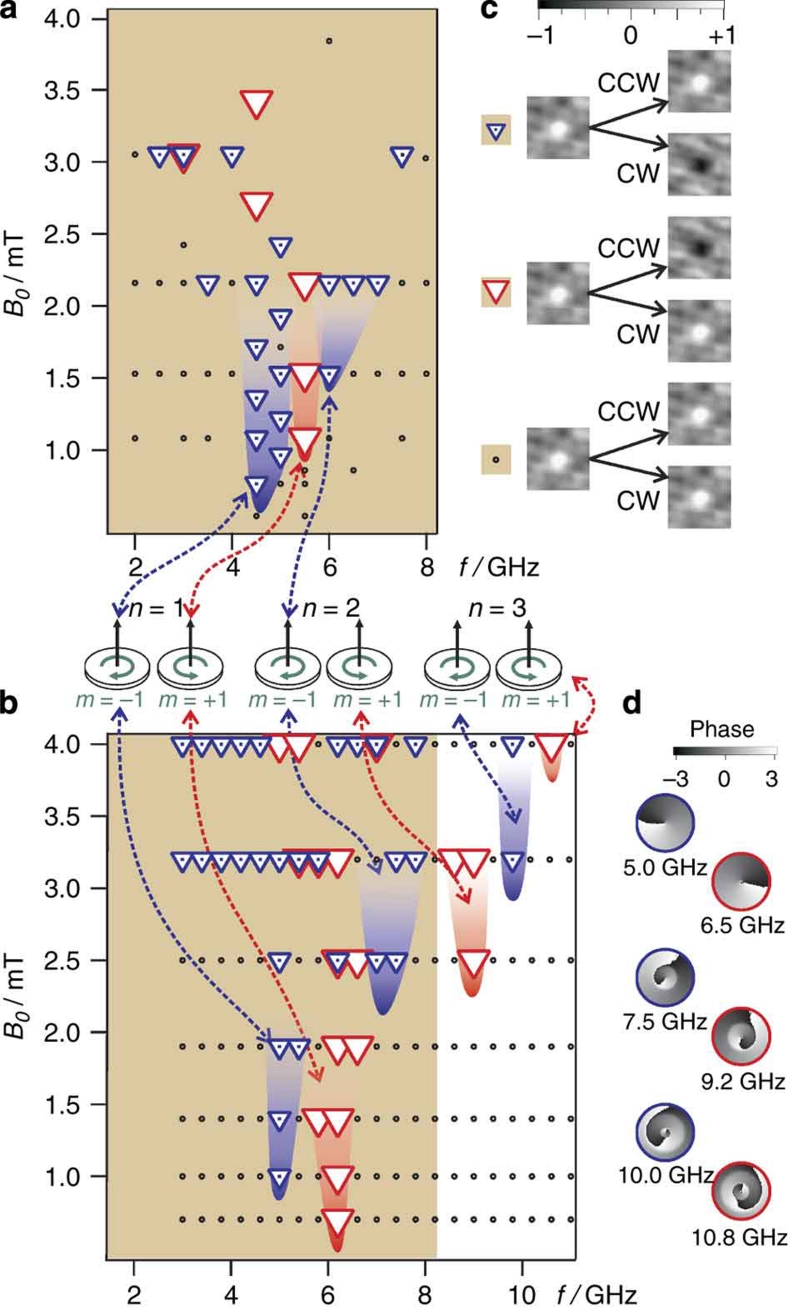
Figure 2. Switching phase diagrams.
The legend (c) shows microscopy images of X-ray transmission through the inner part (150 nm×150 nm) of the sample indicating the vortex core polarity (white: vortex up; black: vortex down) before and after a field burst. The phase diagrams show the points (excitation amplitude versus frequency) where vortex core reversal from up to down was observed in the experiments (a) and the simulations (b). Rotating in-plane magnetic field bursts with an amplitude B0, a frequency f and a duration of 24 periods have been applied. As indicated in the legend of the top panel with the recorded X-ray images (c), the blue triangles with a dot in the middle indicate vortex core switching only after a CW rotating field burst, whereas red triangles indicate switching only after a CCW field burst. Black dots indicate no switching for either rotation sense. The minima in the switching threshold with differing sense of rotation correspond to the resonance frequencies of the excited azimuthal spin wave modes with the same sense of rotation as sketched in the middle of the figure. The modes are identified with the help of the phases derived from a local fast Fourier transform of the simulated out-of-plane magnetization of the sample with 1.62 μm in diameter as shown in the inset to the right of the bottom panel (d).

