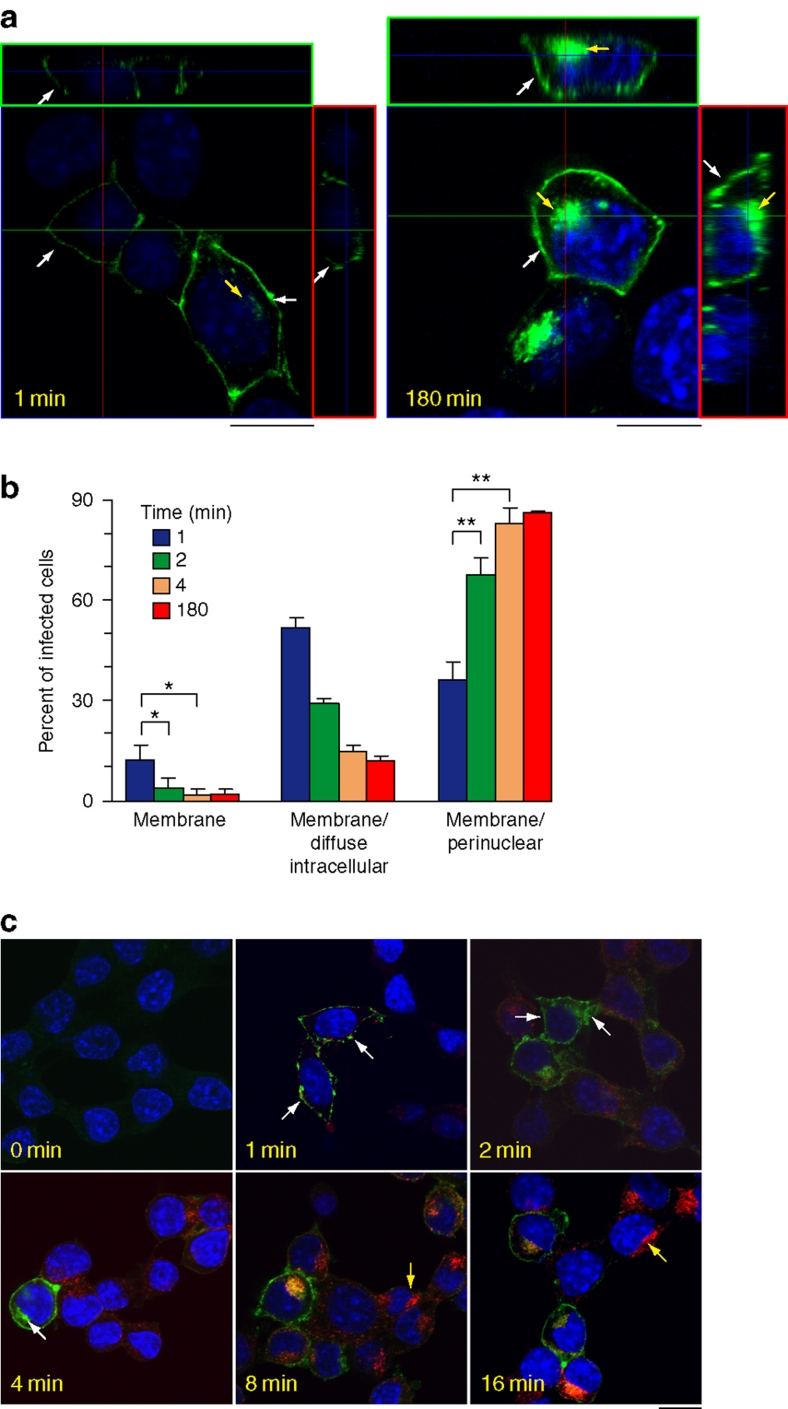
Figure 4. Prion conversion first occurs at the cell surface within 1 min of prion exposure.
(a) PrP224-AlaMYC cells were exposed to RML prions for the indicated durations, and then fixed and extracted with formic acid before staining with anti-MYC antibodies (green) and counterstaining with 6-diamidino-2-phenylindole (DAPI, blue). Orthogonal projections (red and green squares) of serial confocal sections are shown alongside one z-section taken from the middle of the cell (as indicated by the guidelines). A cell fixed after a 1-min exposure to RML prions shows PrPSc immunostaining only at the cell surface (1 min, white arrow). An adjacent cell in the field that has high levels of plasma membrane PrPSc also shows low intracellular levels of PrPSc (1 min, yellow arrow). Cells exposed to RML prions for 180 min show the typical steady-state distribution of PrPSc, with strong immunostaining at the plasma membrane (white arrows) and in the perinuclear region (yellow arrow −180 min); scale bar, 10 μm. (b) Quantification of cell phenotypes observed at different time points following prion exposure (the mean±s.e.m. from four independent experiments are shown; *P<0.05, **P<0.01, two-tailed t-test. The exact P-values are: membrane 1–2 min, 0.022; membrane 1–4 min, 0.049; membrane/PNC 1–2 min, 0.0049; membrane PNC 1–4 min, 0.0057). (c) PrP-224AlaMYC cells were exposed to RML prions and Texas red-labelled transferrin (red) for the indicated durations, then fixed and extracted with formic acid. Merged confocal images of cells stained with anti-MYC antibodies (green) and counterstained with DAPI (blue) are shown; scale bar, 20 μm. Initially, PrPSc shows a plasma membrane distribution (1 min, arrows) and/or diffuse intracellular distribution (2 min, arrows) and then rapidly attains its steady-state distribution concentrated at the plasma membrane and PNC (4 min, white arrow indicates strong PNC stain). Initially, transferrin could be observed in small puncta at the cell periphery, reaching its equilibrium distribution in recycling endosomes at the PNC (yellow arrows) between 8 and 16 min.

