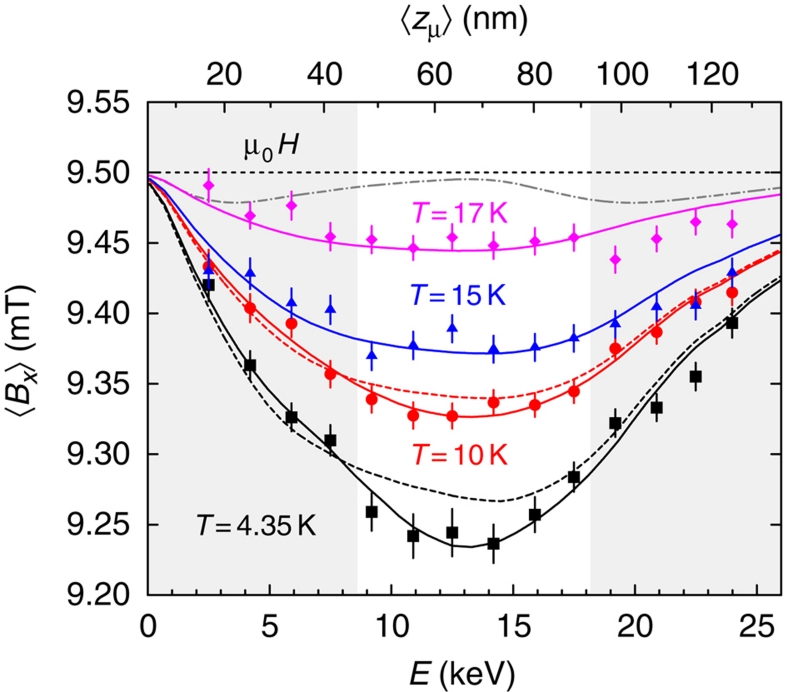
Figure 6. Depth profile of the local field at different temperatures.
The grey shaded areas indicate the top and bottom layers of the La1.84Sr0.16CuO4 (46 nm)/La1.94Sr0.06CuO4 (46 nm)/La1.84Sr0.16CuO4 (46 nm) heterostructure. The horizontal dashed line shows the applied field of 9.5 mT. Points: measured average fields. The entire heterostructure excludes the magnetic flux like a superconductor: it shows the Meissner effect with the UD layer active in the screening. Note that in this geometry all the supercurrent must pass through the region of the heterostructure, which, taken as an isolated layer, would be in the normal state at T〉Tc′. This functional form can only be observed if shielding supercurrents flow across (that is, along the c axis) as well as in the ab planes of the UD barrier. The lines are the fits using the London model described in the text. The fit takes into account the energy-dependent muon stopping profiles, which are also used to calculate the average stop depth 〈zμ〉 (upper scale). The grey dash-dotted line shows the field profile that would be expected (at T=4.35 K) if the shielding current flow were restricted to the upper and lower superconducting electrodes. The dashed lines are obtained if one assumes that supercurrents in the barrier flow only in c direction.

