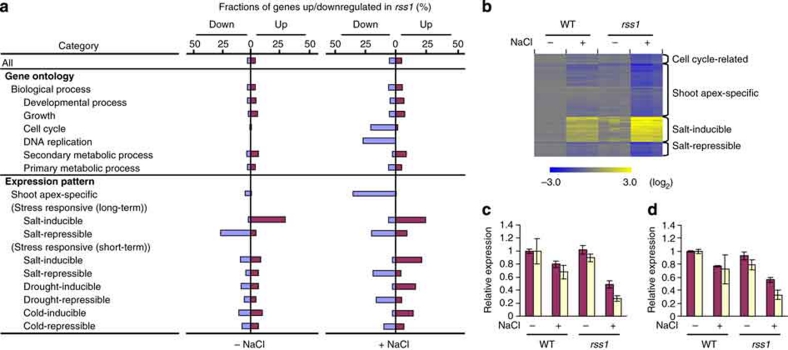
Figure 4. Altered expression of genes in rss1.
(a) The classification of the genes whose expression was affected by the defects in rss1. RNA levels in the shoot basal proliferative tissues of 1-week-old WT and rss1-2 seedlings grown in the absence (−) or presence of 150 mM NaCl (+) were examined by microarray with three biological replicates. Differentially expressed genes were statistically determined by the rank product (P<0.01) and two-way ANOVA (P<0.01). The ratio of the number of genes, whose expression was significantly upregulated (magenta) or downregulated (blue) in rss1, to the number of genes in the indicated gene category is shown. Among the total number of 29,859 genes examined, 1,129 genes (3.8%) and 792 genes (2.7%) were up- and downregulated in rss1, respectively, under the normal growth condition, whereas 1,607 genes (5.4%) and 1,581 genes (5.3%) were up- and downregulated in rss1, respectively, under conditions of salinity. Categories included in 'Biological process' were selected from the Gene Ontology (GO) database (http://www.gramene.org/plant_ontology/index.html). Categories of 'Shoot apex-specific,' stress responsive (long-term) and stress responsive (short-term) were selected from our microarray data and public array databases (see Methods). (b) A heat map view of the expression pattern of down- or upregulated genes selected from the indicated categories. 'Salt-inducible' (or 'salt-repressible') genes are a mixture of genes that were commonly up- (or down)regulated under the both long- and short-term salinity conditions. The levels of expression are shown with log2-transformed values (bottom) based on the microarray data, as in (a). The patterns of expression with the three biological replicates are shown. (c, d) The expression of PCNA (c) and CycB2;1 (d) in the basal shoot tissues of one-week-old WT and rss1-2 seedlings, as determined by microarray analysis (magenta), or of WT and rss1-1, as determined by quantitative RT-PCR (yellow). Seedlings were grown in the absence (−) or presence of 150 mM NaCl (+). Mean±s.d., n=3. The relative expression levels in the real-time RT-PCR analysis were normalized by the expression level of ubiquitin E2.

