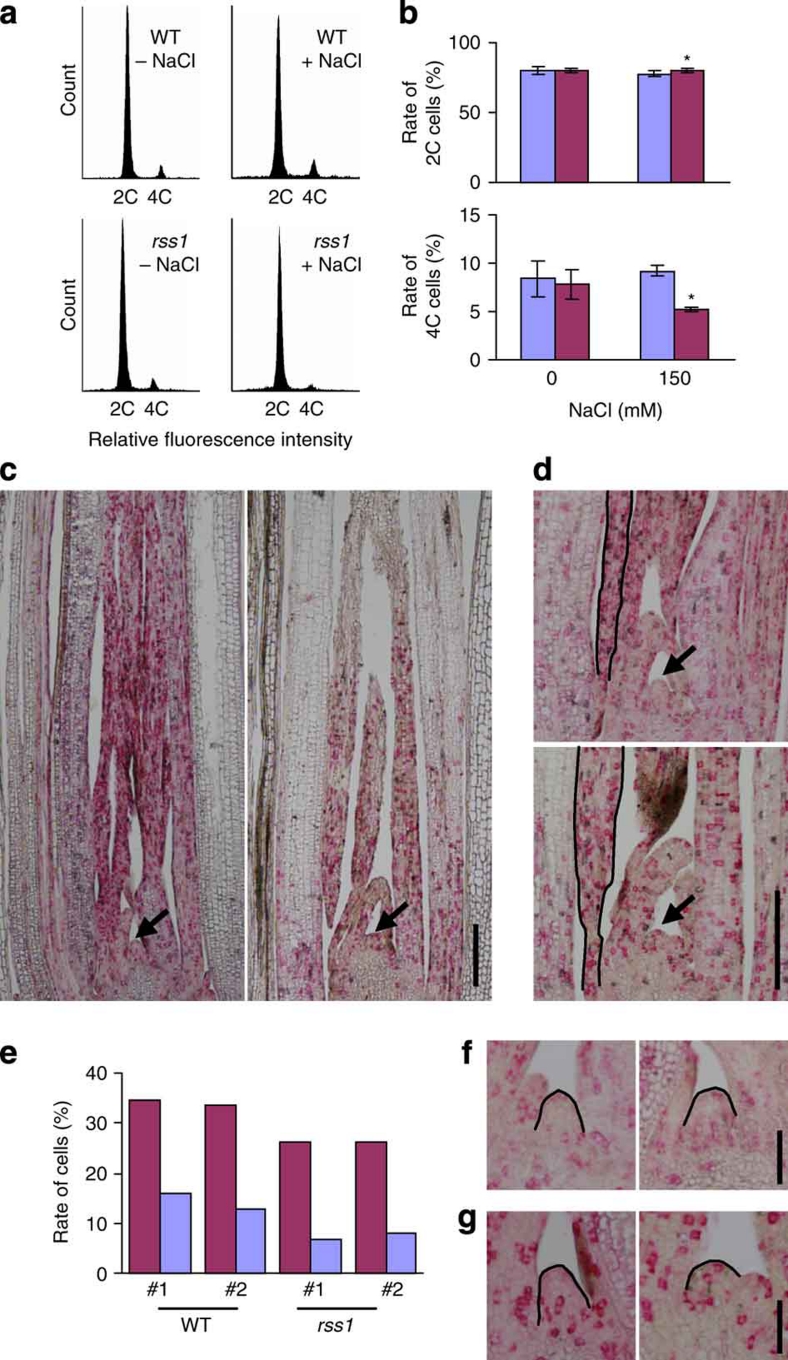
Figure 5. RSS1 ensures cell division activity at the G1–S transition.
(a, b) Flow cytometry measurements of nuclei from the basal shoot tissues in 1-week-old WT and rss1-2 plants grown under non-stressed (−NaCl) and salt-stressed (+150 mM NaCl) conditions. (a) The representative data of the 2C and 4C cells. The number of nuclei is plotted according to their fluorescence intensity. (b) The ratio of the 2C (top) and 4C (bottom) cells in WT (blue) and rss1-2 (magenta). Mean±s.d., n=5–9. Asterisks, a significant difference between WT and rss1-2 (P=0.0052 (top panel), P=0.0002 (bottom panel); one-tailed t-test). (c, d) In situ analysis of the expression of histone H4 (red) and cyclin B2 (purple). Antisense probes for histone H4 and cyclin B2 were labelled differentially and hybridized with longitudinal sections of the basal shoot in WT and rss1-2 seedlings grown in the presence of 150 mM NaCl. (c) Overviews of the longitudinal sections, including the shoot apical meristem (SAM) and leaf primordia of WT (left) and rss1-2 (right). (d) Magnified views of the in situ detection of transcripts for histone H4 (red) and cyclin B2 (purple) in the shoot basal tissue. (top) WT. (bottom) rss1-2. Black lines trace the leaf margin of primordium 3 (P3). (e) Rate of cells that express transcripts for histone H4 (magenta) and cyclin B2 (blue) in the leaf margin of P3 in (d). Two seedlings (nos. 1 and 2) were analysed for WT and rss1-2, respectively. The average scores based on the observation of two to three serial sections are shown. (f, g) In situ detection of histone H4 mRNA (red signals) in the SAM region in WT (left each) and rss1-2 (right each) plants grown under non-stressed (f) and salt-stressed conditions (g). The regions of layer 1 (L1) in the SAM used for counting the cell number are traced by black lines. Arrows indicate the SAM in (c, d). Bars indicate 200 μm in (c, d), and 50 μm in (f, g).

