Figure 5.
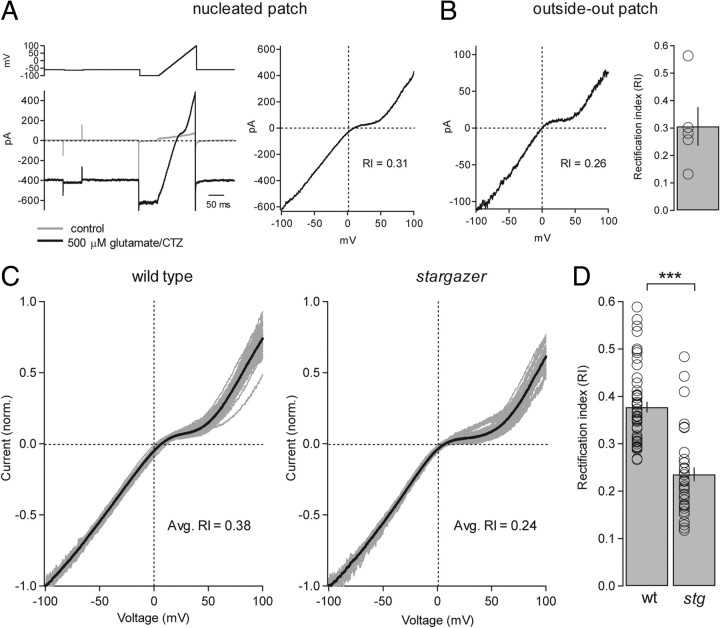
Inward-rectification of extrasynaptic/somatic AMPARs is enhanced in stargazer mice. A, Example of glutamate/CTZ-evoked, AMPAR-mediated current in a nucleated patch from a wild-type SC while applying a fast voltage ramp (left). The patch was held at −60 mV while the voltage ramp ran from −100 and +100 mV over 100 ms (2000 mV/s) and was applied at a frequency of 1 Hz. Control solution contained picrotoxin, d-AP5, TTX, and CTZ. Control current was then subtracted from agonist-evoked current and plotted as a function of voltage and, in this example, with an RI of 0.31 (right). B, A representative conventional outside-out patch from a SC from the same slice (left) with an RI value of 0.26. Bar graph representing average RI from conventional outside-out patches from wild-type SCs (average RI = 0.31 ± 0.07, n = 5) (right). C, Normalized I–V curves from wild-type (left) and stargazer (right) nucleated patches. Curves from individual SCs are shown in gray and the averaged curves are shown in black. D, Bar plot showing the collected RI values for I–V curves from nucleated patches from wild-type (wt) and stargazer (stg) SCs (wt: average RI = 0.38 ± 0.01, n = 51; stg: average RI = 0.24 ± 0.02, n = 38; p < 0.0001, Wilcoxon rank sum test). Open circles represent values from individual cells. Asterisks indicate significance: ***p < 0.0005.

