Figure 6.
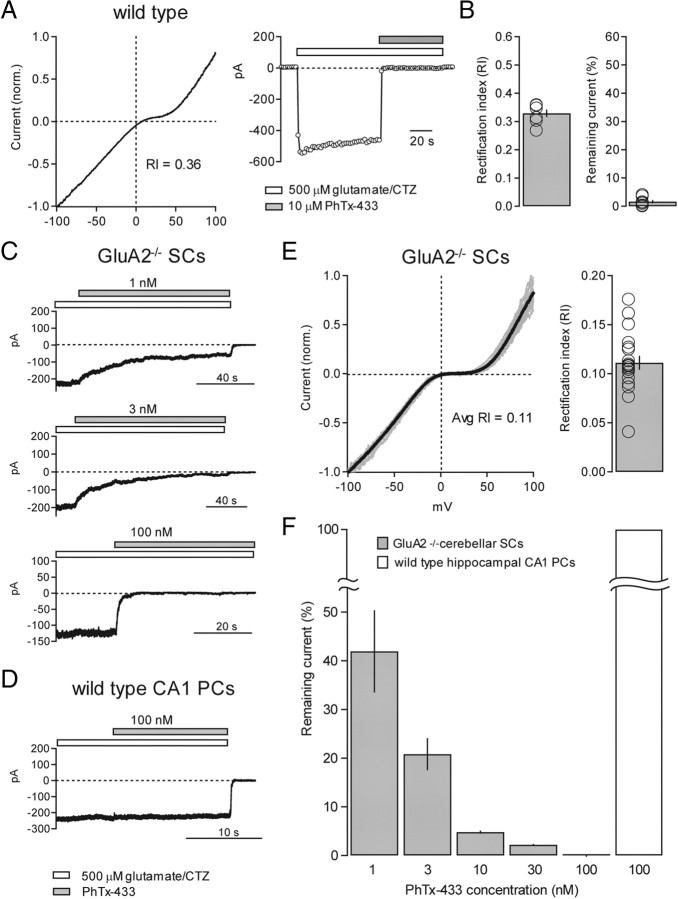
Calibrating the selectivity of use-dependent block of GluA2-lacking AMPARs by PhTx-433 using GluA2−/− mice. A, Typical example of a nucleated patch from a wild-type SC that was subjected to both a voltage ramp (left) and block by 10 μm PhTx-433 (right). The RI value was 0.36, yet the current was rapidly and completely blocked by 10 μm PhTx-433. B, Bar graph showing RI values of wild-type SC nucleated patches subjected to block by 10 μm PhTx-433 (average RI = 0.33 ± 0.01, n = 7) (left). Bar graph showing remaining current (%) in 10 μm PhTx-433 in the same patches (average remaining current = 1.6 ± 0.6%, n = 7) (right). Open circles represent values from individual cells. C, Representative examples of glutamate/CTZ-evoked currents in nucleated patches from GluR2−/− SCs blocked by varying concentrations of PhTx-433 (1, 3, and 100 nm). Note rapid and complete block using 100 nm PhTx-433. D, Representative example of an outside-out patch recording from a hippocampal CA1 pyramidal neuron where glutamate/CTZ-evoked current was untouched by 100 nm PhTx-433. E, Normalized I–V curves from nucleated patches pulled from GluR2−/− SCs. Individual curves are shown in gray and the average curve is in black (left). Bar graph shows average RI of GluR2−/− I–V curves (average RI = 0.11 ± 0.01, n = 19) (right). F, Bar graph representing the percentage glutamate/CTZ-evoked current remaining following block by progressively increasing concentrations of PhTx-433: 1 nm (percentage remaining = 41.9 ± 8.5%, n = 4); 3 nm (percentage remaining = 20.1 ± 2.7%, n = 10); 10 nm (percentage remaining = 4.8 ± 0.3%, n = 4); 30 nm (percentage remaining = 2.2 ± 0.2%, n = 3); and 100 nm (percentage remaining = 0%, n = 2).

