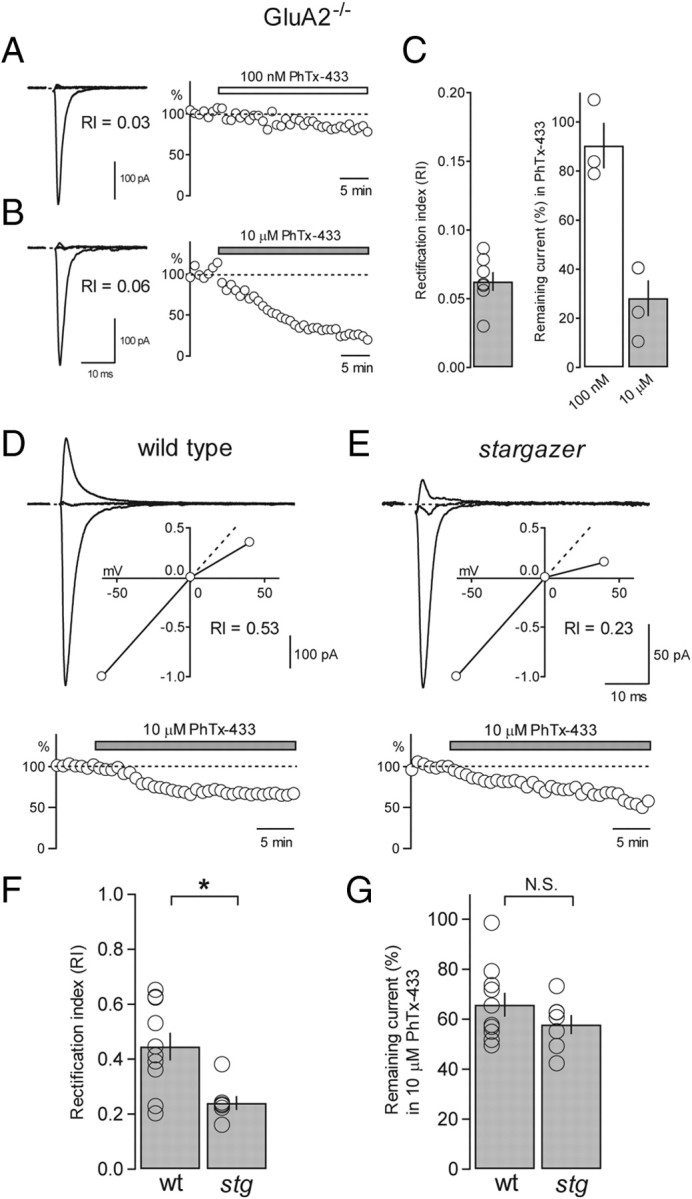
Figure 8.

Using PhTx-433 to quantify GluA2 content of synaptic AMPARs from wild-type and stargazer SCs. A, Overlay of synaptic eEPSCs from a GluA2−/− SC (−60, 0, and +40 mV; RI = 0.03) with stimulus artifacts blanked (left). Time course of block of the same cell subjected to bath application of 100 nm PhTx-433 (remaining current = 83.6%) at a holding potential of −60 mV (right). B, Synaptic eEPSCs from another GluA2−/− SC (RI = 0.06) (left). The same cell subjected to bath application of 10 μm PhTx-433 (remaining current = 22.2%) (right). C, Bar graph showing average RI of synaptic I–V curves from GluR2−/− SCs (average RI = 0.06 ± 0.01, n = 7) (left). Bar graph comparing the average remaining current (%) following bath application of 100 nm PhTx (white bar; average remaining current = 90.4 ± 9.3%, n = 3), and 10 μm PhTx (gray bar; average remaining current = 28.2 ± 7.3%, n = 4) (right). D, Overlay of eEPSCs from a wild-type SC with an inset showing the normalized I–V (RI = 0.53) (top). Time course of block of the same cell subjected to bath application of 10 μm PhTx-433 (remaining current = 65.2%) (bottom). E, eEPSCs from a stargazer SC with an inset showing the normalized I–V (RI = 0.23) (top). Time course of block of the same cell subjected to bath application of 10 μm PhTx-433 (remaining current = 55.0%) (bottom). F, Bar graph comparing collected RI values from wild-type (wt) and stargazer (stg) PF-SC synapses, also subjected to bath application of 10 μm PhTx-433 (wt: average RI = 0.45 ± 0.05, n = 10; stg: average RI = 0.24 ± 0.03, n = 7; p < 0.05, Wilcoxon rank sum test). G, Bar graph showing that the current that remained unblocked in 10 μm PhTx-433 was not significantly different between conditions (wt: average remaining current = 65.7 ± 4.8%, n = 10; stg: average remaining current = 57.8 ± 3.8%, n = 7; N.S., Wilcoxon rank sum test). Open circles represent values from individual cells. Asterisks indicate significance, *p < 0.05. N.S., not significant.
