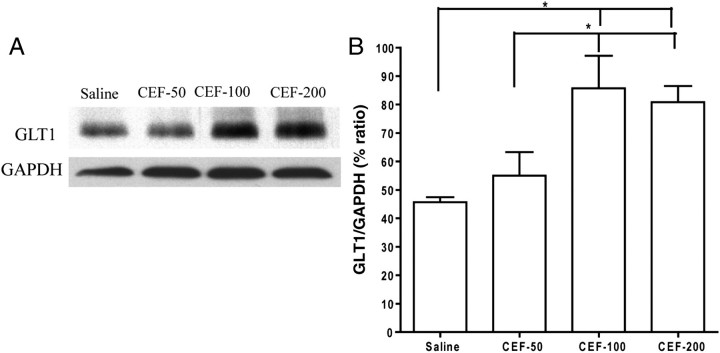
Fig. 6.
Effects of 50 mg/kg (CEF-50, n = 4), 100 mg/kg (CEF-100, n = 4), 200 mg/kg (CEF-200, n = 4) CEF or saline treatment (n = 4) on GLT1 expression in NAc. (A) Each panel presents immunoblots for GAPDH, which was used as a control loading protein, and GLT1. (B) Quantitative analysis revealed a significant increase in the ratio of GLT1/GAPDH in the CEF-100 and CEF-200 groups when compared with the saline vehicle and CEF-50 groups. Error bars indicate SEM (*P < 0.05).

