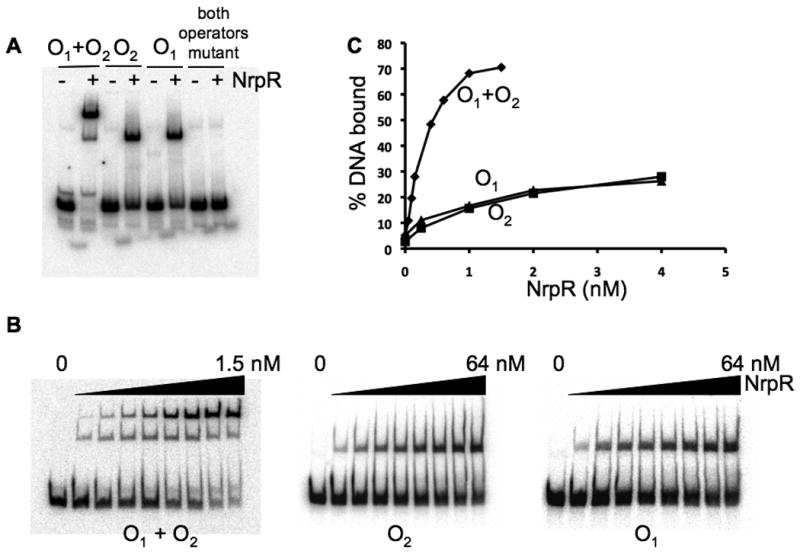
Fig. 3. Electrophoretic mobility shift analysis (EMSA) of NrpR binding to operator DNA.

A. DNA probes containing operators shown in Fig. 1: wild type (O1+O2), O2 only (O1 mutant), O1 only (O2 mutant), and both operators mutant. No (-) or 120 nM (+) NrpR was mixed with the DNA.
B. EMSA at different NrpR concentrations: O1+O2, 0, 0.05, 0.1, 0.15, 0.2, 0.4, 0.6, 1.0, and 1.5 nM; O2 and O1, 0, 0.25, 1, 2, 4, 8, 16, 32, and 64 nM.
C. Plot of data from B.
