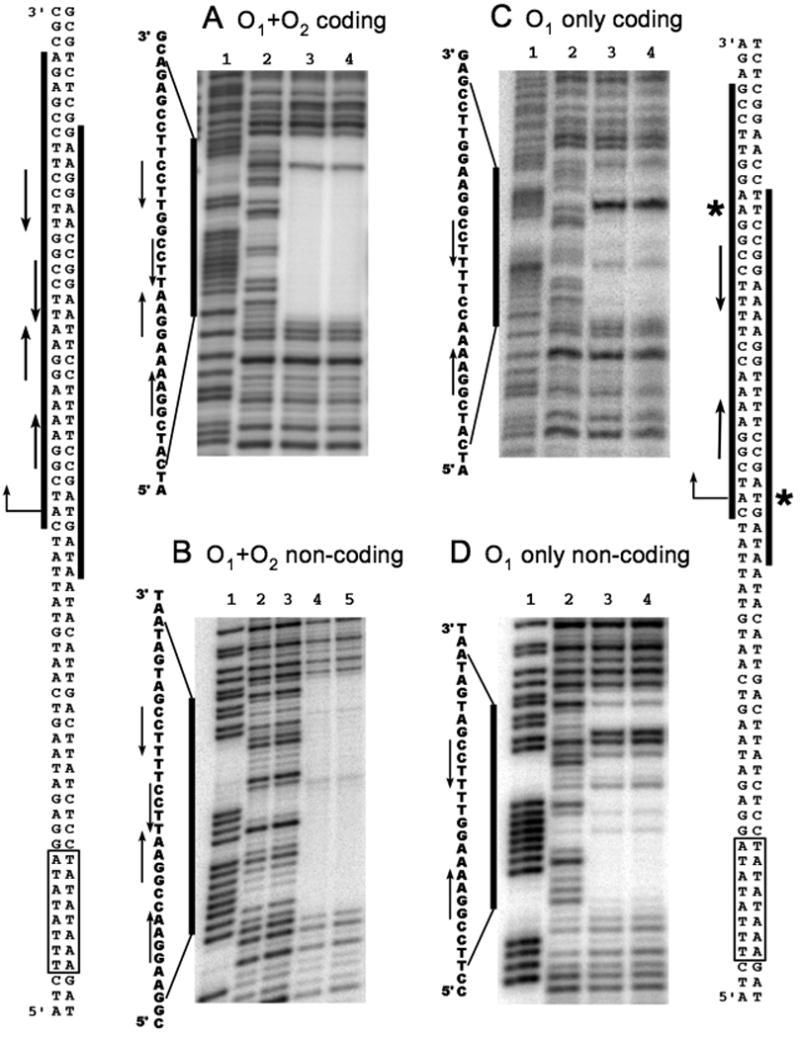
Fig. 4. DNAse I footprinting analysis of NrpR binding to operator DNA.

Footprints are delineated by bold lines and indicated with respect to the sequence. Double stranded DNA sequences on left and right represent O1+O2 and O1 only, respectively. Boxed sequences, TATA box; bent arrow, transcription start site; inverted arrow pairs, operator(s); asterisks, hypersensitive sites.
A, C and D. Lane 1, G+A ladder; lane 2, no NrpR; lane 3, 200 nM NrpR; lane 4, 400 nM NrpR. Units of DNAse I, 0.005
B. Lane 1, G+A ladder; lanes 2 and 3, no NrpR, lanes 4 and 5, 400 nM NrpR.; Units of DNAse I: lanes 2 and 4, 0.001; lanes 3 and 5, 0.002.
