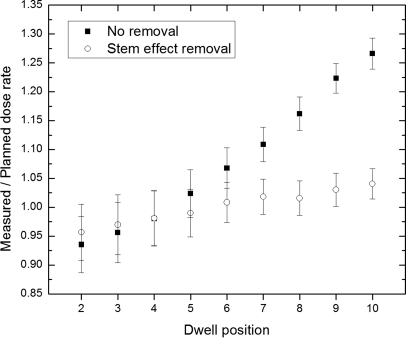
Figure 8.
Ratio of dose rate between the measured and planned values with and without chromatic removal of the stem effect. The plastic scintillation detector was inserted in the urethra aligned to dwell position #1, and the data shown here are for dose delivery in catheter #4. Uncertainty on measurements was calculated from the standard deviation from ten consecutive data points (1 s span) for the same dwell position.

