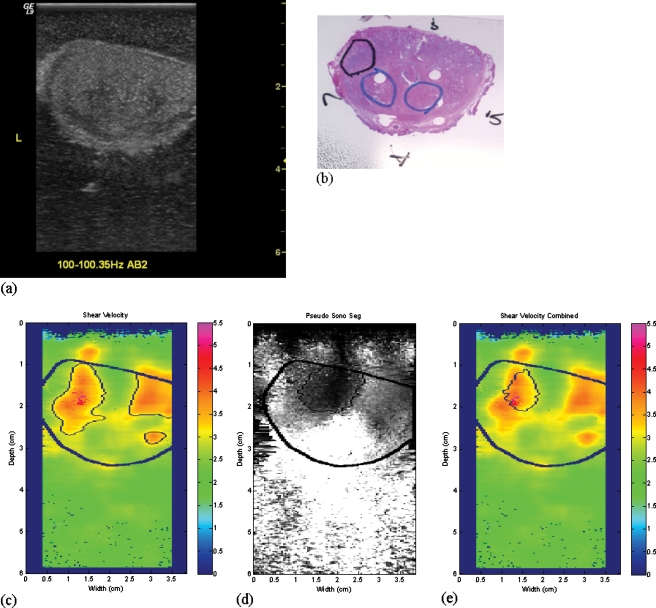
Figure 6.
An illustration of the combined approach. Shown are coregistered images of a transverse slice of a prostate. (a) The B-mode image. (b) The histology slice with thick black circle indicating cancer and other light clue circles indicating BPH. (c) The CrW segment. (d) The amplitude-sonoelastography segment. (e) The final segment. Color scale units are cm∕s.

