
Figure 3.
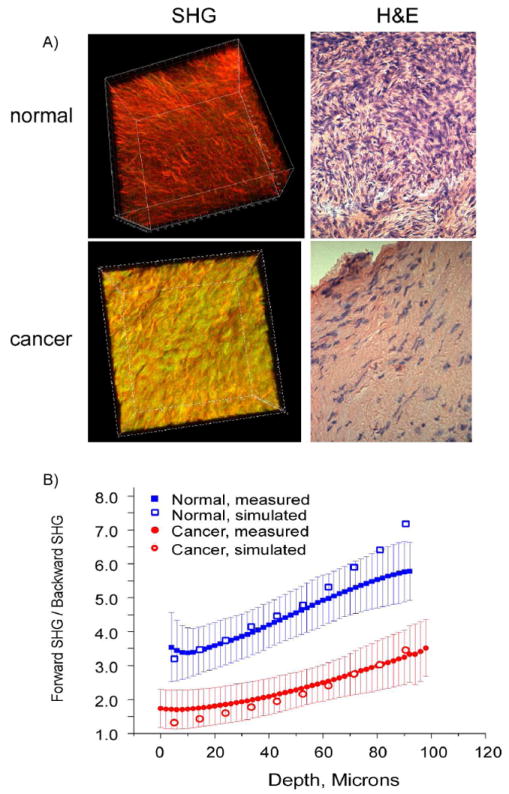
SHG imaging of human ovarian cancer. A) 3D SHG renderings (left panels) and H&E staining (right panels) of normal (top) and malignant (bottom) ovarian tissues. The field size for the 3D renderings was 170 μm and the histology cross sections were captured at 40x. Both the SHG and histological images reveal that the malignant tissues are characterized by a denser 3D collagen structure with lower cell density. B) Monte Carlo simulations of the measured F/B response for normal (blue) and malignant (red) ovarian tissues using measured bulk optical parameters. The best fit simulation to the data in each case is overlapped with the experimental data.