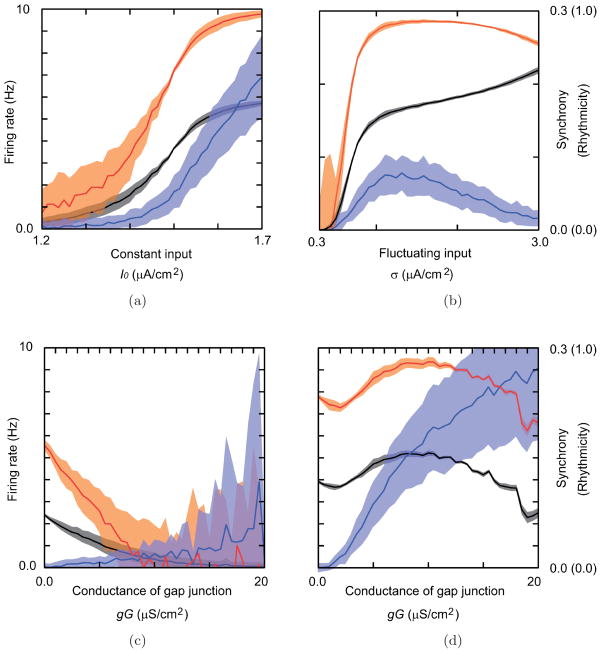
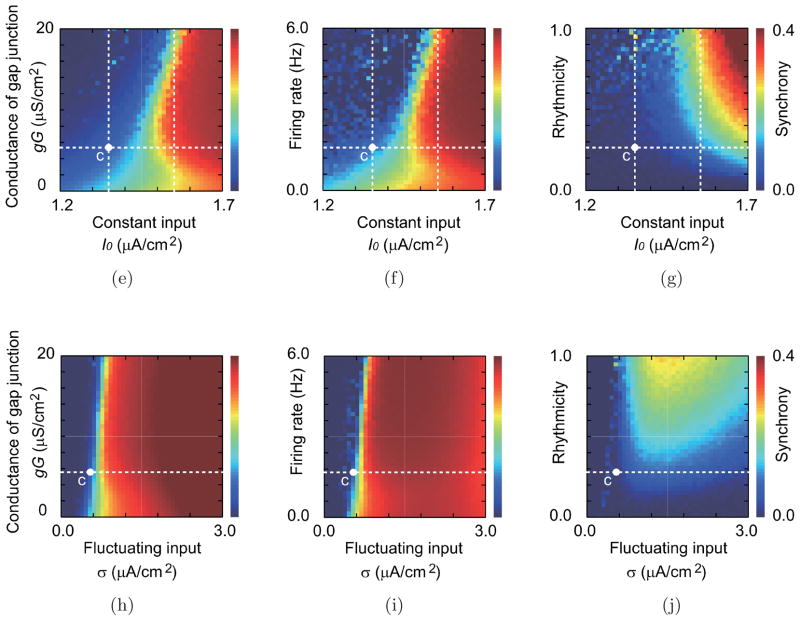
Fig. 10.
Parameter dependence of the firing rate, rhythmicity, and spike synchrony in simulations. (a–d) The mean and the standard deviation of the firing rate (black curves and gray bands), those of the rhythmicity (orange curves and orange band) and those of the synchrony of each pair (blue curves and blue bands) in the simulations. (a) Dependence on the magnitude of the constant input, and (b) that of the fluctuating input. (c, d) Dependence on the coupling of the gap junction in (c) a relatively low input current range as in the control condition (I0 = 1.35 μA/cm2), and in (d) a high input current range that corresponds to the picrotoxin condition (I0 = 1.55 μA/cm2). (e–j) Dependence of (e, h) the firing rate, (f, i) the rhythmicity, and (g, j) the synchrony, respectively, on the two parameters: namely, the constant input current and the conductance of gap junction (e–g), and the fluctuating input and the conductance of gap junction (h–j). White dashed lines indicate the parameter values of a–d. The white point with mark “c” indicates the parameter values specified with the control condition.


