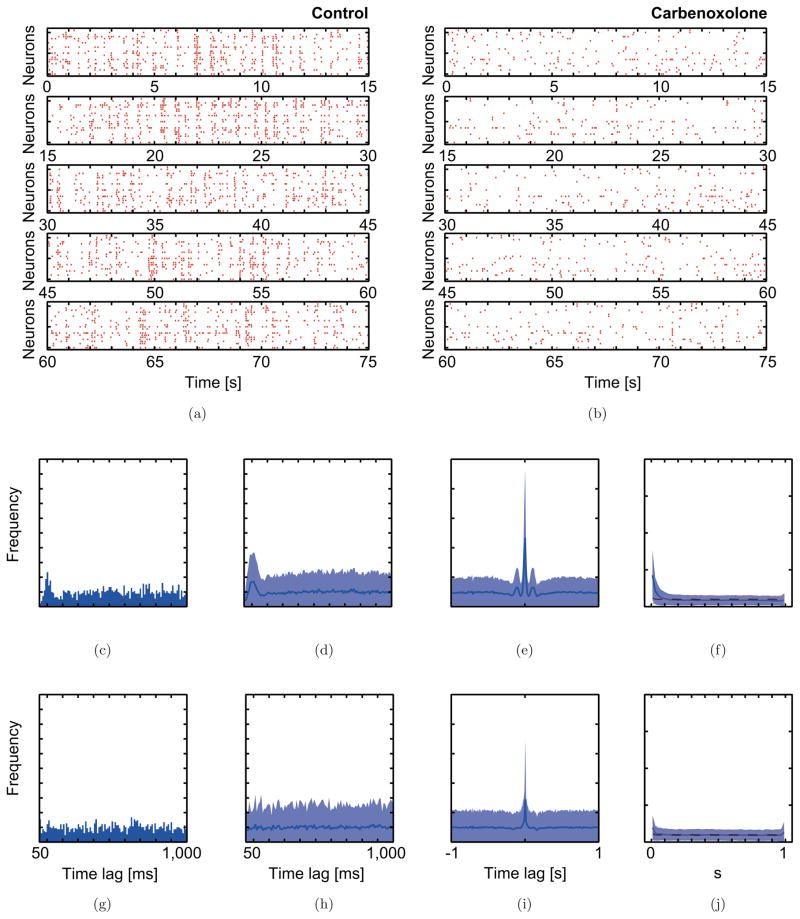
Fig. 2.
Spiking patterns of rat CS activity and statistical distributions that characterize the CS activity in the carbenoxolone experiment. Raster plots of CS activity simultaneously recorded from 22 Purkinje cells before (a) and after (b) the injection of carbenoxolone. Statistical distributions illustrate the characteristic CS activity before (c)–(f) and after (g)–(j) carbenoxolone injection. (c, g) Auto-correlograms of CS activity from a typical Purkinje cell before and after carbenoxolone injection. (d–f and h–j) show 22-channel averaged statistics of (d, h) auto-, (e, i) cross-correlograms, and (f, j) minimal distance distributions.

