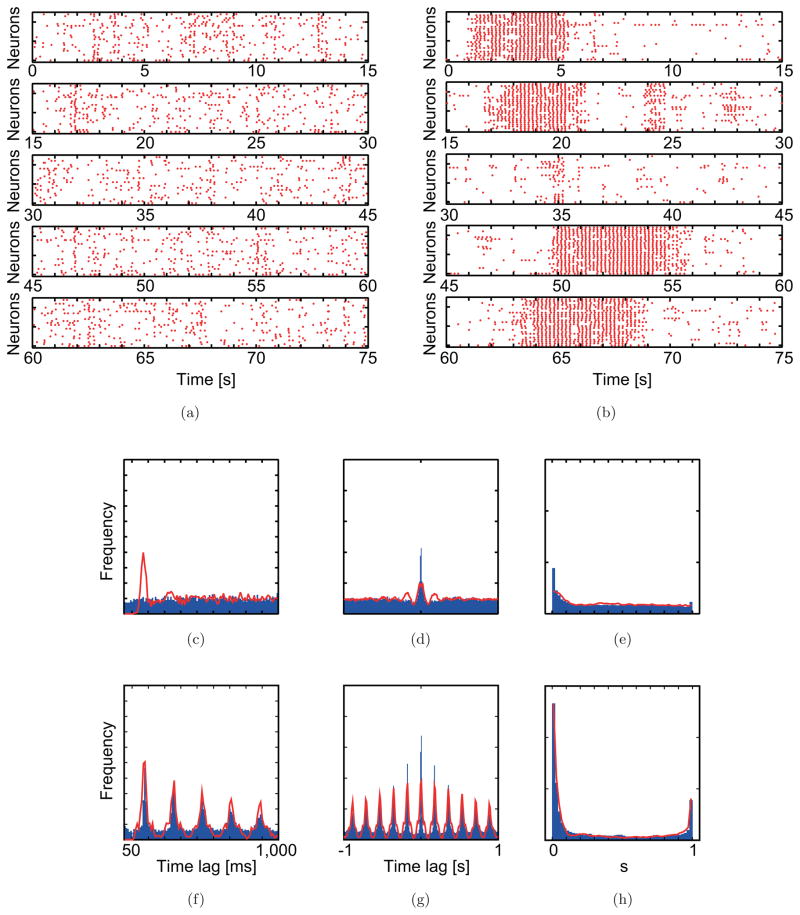
Fig. 4.
Simulation results obtained using optimized parameter values reproduce the spiking pattern of CS activity before (a and c–e) and after (b and f–g) picrotoxin injection. In the raster plots (a, b), the vertical axes of each plot indicate an index of 25 neurons. The horizontal axes indicate time. Each dot indicates the time of a CS. Typical 75s durations are shown. In the statistical distribution plots, blue bars and red curves show experimental and simulation data, respectively. (c, f) Averaged auto-correlograms. (d, g) Averaged cross-correlograms. (e, h) The minimal distance distributions.

