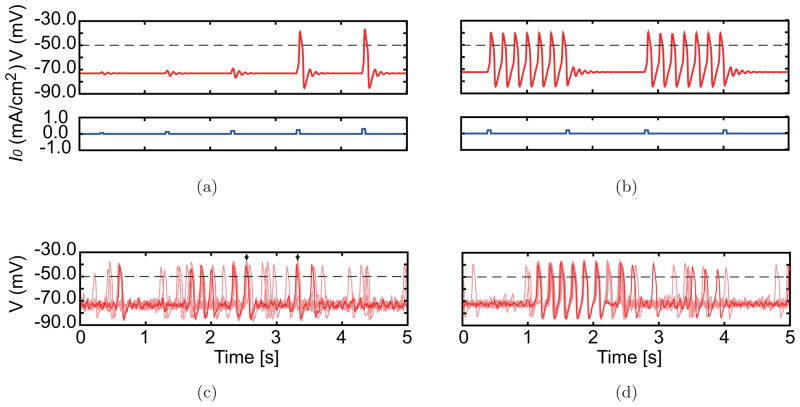
Fig. 8.
Membrane potential responses to current stimulations in simulations. Membrane potential time courses of 5s durations are shown. Horizontal dashed lines indicate the threshold potential that could mark spike occurrence times. (a, b) Responses of a single neuron (red traces) to current pulses with 50 ms width, which are superimposed on a constant input whose magnitude is specified for the two conditions (blue traces). (c, d) Typical responses of gap junction-coupled neurons (N = 25) with fluctuating input (10 of 25 neurons are plotted). A typical trace of a single neuron is plotted by the bold curve. Some synchronous spikes are indicated by arrows in c.

