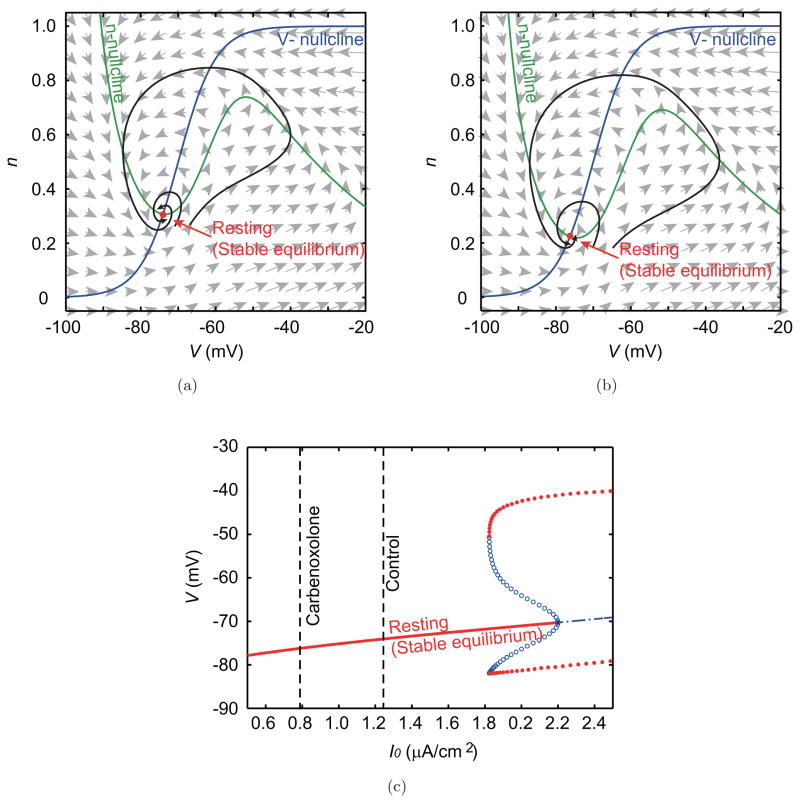
Fig. 9.
Phase planes and the bifurcation diagram in the carbenoxolone experiment. Phase planes in (a) the control and (b) the carbenoxolone condition show the same qualitative structure, which consists of a stable equilibrium point (resting state). (c) The corresponding bifurcation diagram. Dashed vertical lines indicate the estimated magnitudes of the constant input.

