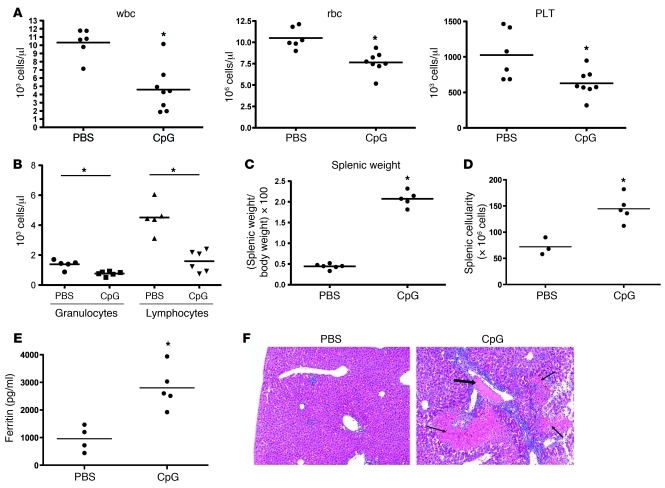
Figure 1. Repeatedly CpG-treated mice develop clinical features of cytokine storm.
Mice were treated over a 10-day period with repeated injections of PBS or CpG (50 μg) every 2 days. (A) Blood was sampled on day 8 for a complete blood count and analyzed for total leukocytes (wbc), rbc, and platelets (PLT). (B) The leukopenia associated with CpG treatment was further characterized by assessing lymphocyte and granulocyte numbers. (C–E) Analyses were performed at sacrifice on day 10. (C and D) Spleens from mice were weighed and are expressed at a ratio to total body weight. Total splenocyte numbers were assessed by counts with a hemacytometer. (E) Serum ferritin was measured by ELISA. (F) Livers from mice were sectioned and stained with H&E (original magnification, ×40). Fibrin thrombi (thick arrows) and associated tissue necrosis (thin arrows) were seen only in CpG-treated mice. Individual symbols each represent 1 mouse, with the horizontal lines representing the mean values. *P < 0.05 versus PBS for all panels. Data are representative of 3 experiments.

