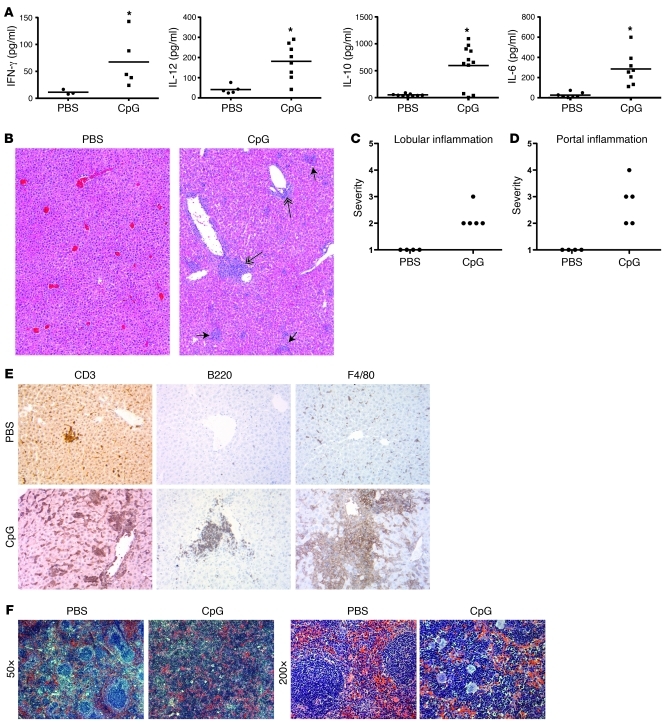
Figure 2. Repeatedly CpG-treated mice develop serologic and histologic features of cytokine storm.
Mice were treated with PBS and CpG as in Figure 1. (A) Serum levels of IFN-γ, IL-12, IL-10, and IL-6 were assessed by ELISA at day 10. (B–D) Hepatic inflammation was assessed at sacrifice on day 10 by a blinded pathologist using a standardized scoring system as follows: portal inflammation, 0, absent; 1, focal and minimal; 2, mild; 3, moderate; 4, marked; lobular inflammation, 0, absent; 1, rare small foci; 2, occasional small foci; 3, moderate small foci; 4, frequent small foci. (B) Livers were stained with H&E. Lobular infiltrates are marked with short arrows, and portal infiltrates are marked with long double arrows. Representative sections are shown at an original magnification of ×40. (C) Lobular and (D) portal inflammation were scored separately. (E) Hepatic infiltrates were stained by immunohistochemistry for T cell (CD3), B cell (B220), and macrophage (F4/80) markers. Representative sections are shown at an original magnification of ×200. (F) Splenic architecture was assessed by H&E stains of spleens on day 10 (original magnification, ×50 [left]; ×200 [right]). *P < 0.05 versus PBS for all experiments. Data are representative of 3 experiments. Individual symbols each represent 1 mouse, with the horizontal lines representing the mean values.

