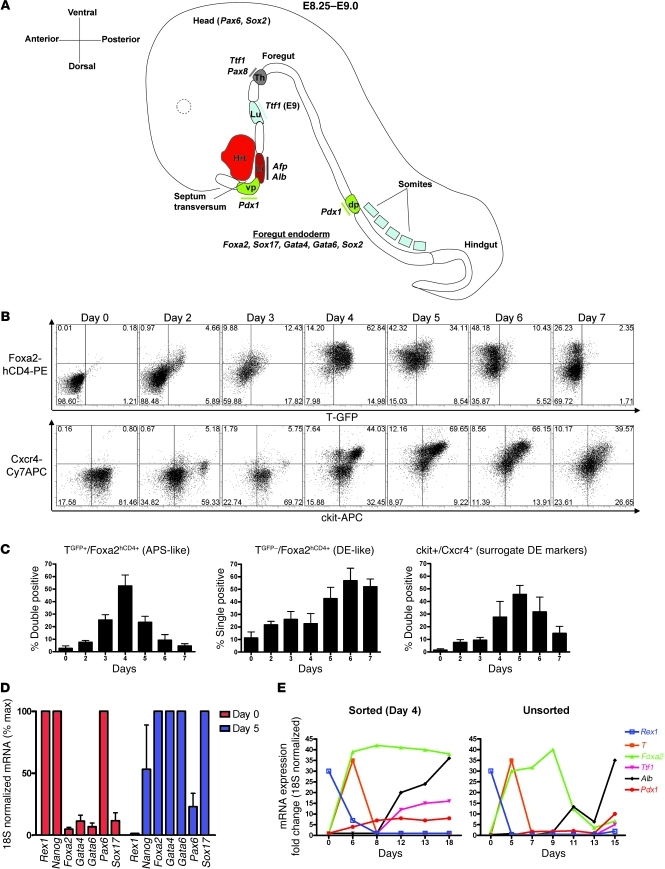
Figure 1. Kinetics of differentiation of ES cells into DE.
(A) Schematic of the mouse E8.25–E9.0 developing embryo, indicating transcription factors and marker genes induced as the foregut endoderm is patterned into prospective organ domains of thyroid, lung, liver, and dorsal/ventral pancreas. Hrt, heart; vp, ventral pancreas; Li, liver; Lu, lung; Th, Thyroid; dp, dorsal pancreas. (B) Flow cytometry quantification of the kinetics of endodermal differentiation of the 129/Ola ES cell line containing GFP and hCD4 reporters knocked-in to the brachyury (T) and Foxa2 loci, respectively. Numbers in each quadrant indicate the percentage of cells in that quadrant. (C) Summary of endodermal differentiation kinetics of ES cells, displayed as the percentage of cells at each time point, displaying the flow cytometry profile of anterior primitive streak–like (APS-like) cells (T+/Foxa2+) or DE-like cells (T–/Foxa2+), or coexpressing ckit+/CXCR4+ cells, which are considered surrogate markers of endoderm differentiation. Error bars represent average ± SEM. (D) Day 0 versus day 5 expression of transcription factors during endodermal differentiation of ES cells, as assessed by qRT-PCR. Error bars represent average ± SEM. (E) qRT-PCR assessment of the kinetics of gene expression of ES cells in a 2-step protocol designed to accomplish DE differentiation (stage 1), followed by lineage specification (stage 2; day 6–18). T+/Foxa2+/ckit+ APS-like cells were sorted on day 4 (left panel).

