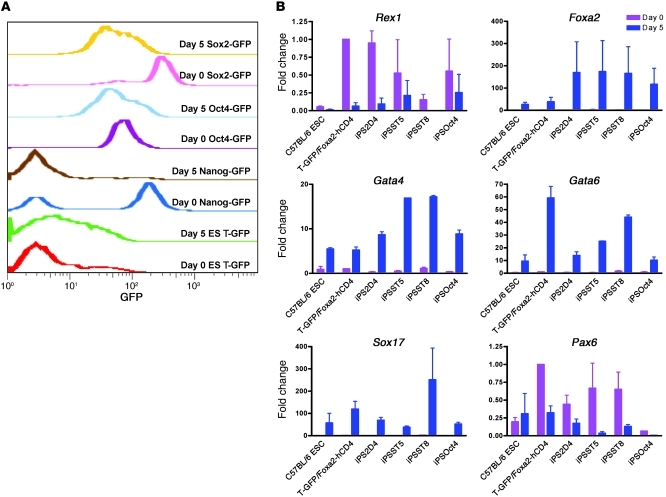
Figure 2. Gene expression changes in nonisogenic ES and iPS cells undergoing directed differentiation to DE over 5 days.
(A) Flow cytometry assessment of expression of GFP reporters targeted to each indicated locus in ST8 iPS cells (Sox2-GFP), Oct4 iPS cells (Oct4-GFP), 2D4 iPS cells (Nanog-GFP), and 129/Ola ES cells (T-GFP). (B) qRT-PCR assessment of the levels of gene expression of each indicated marker or transcription factor on day 0 versus day 5 of directed differentiation (mean fold-change expression ± SEM). ESC, ES cell; T-GFP/Foxa2-hCD4, 129/Ola ES cell line; iPS2D4, Nanog-GFP iPS cell line; iPSST5, Sox2-GFP clone 5 iPS cell line; iPSST8, Sox2-GFP clone 8 iPS cell line; iPSOct4, Oct4-GFP iPS cell line.

