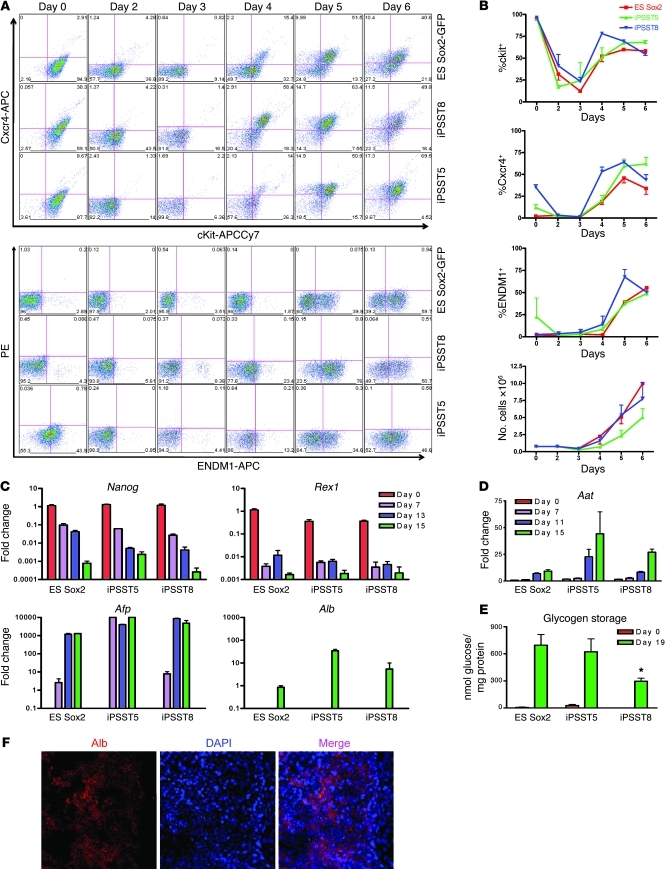
Figure 3. Comparison of strain-matched ES and iPS cell capacity to undergo directed differentiation to DE, followed by hepatic lineage specification.
(A) iPS cell clones (ST5 and ST8) and their parental syngeneic ES cells (Sox2-GFP) were differentiated in parallel to endoderm. The kinetics of expression of ckit, CXCR4, and the DE marker ENDM1 were measured by flow cytometry. PE indicates autofluorescence. Numbers in each quadrant indicate the percentage of cells in that quadrant. (B) Summary of kinetics and cell counts from 3 repeated experiments. (C and D) Gene expression kinetics (qRT-PCR; n = 3) during hepatic lineage specification. Note sequential decrement of pluripotent markers and induction of α-fetoprotein (Afp), followed by α-1 antitrypsin (Aat), followed by expression of albumin (Alb). (E) Glycogen storage capacity of undifferentiated (day 0) cells versus day 19 hepatocyte-like cells derived from each ES and iPS cell clone. *P < 0.05, comparing the difference in glycogen storage capacity between ST8-derived and ES-derived cells (2-tailed t test). (F) Albumin (red) immunostaining in day 18 iPSST5-derived hepatocytes. Nuclei were stained with DAPI (blue). Original magnification, ×10. Graphs represent 3 biological replicates; error bars represent mean ± SEM.

