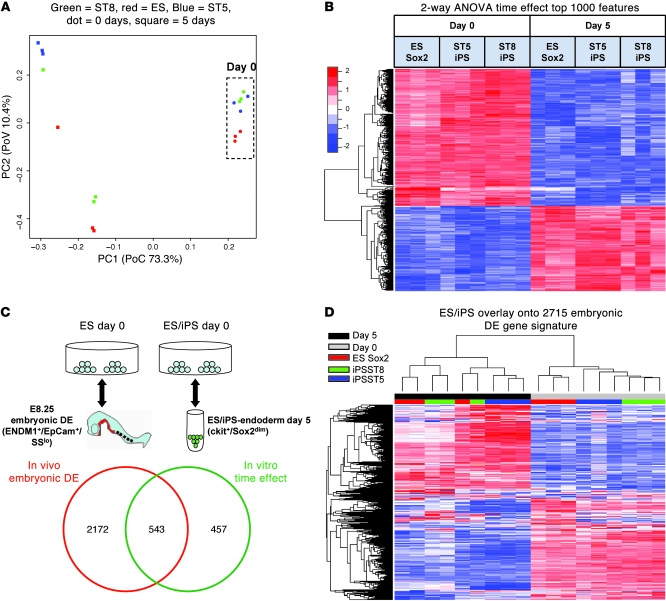
Figure 5. Microarray analysis of global gene expression in ES and iPS cells before (day 0) and after (day 5) endodermal differentiation.
(A) Principal components analysis (PCA) of 18 samples reveals tight grouping of iPS cell clones in the undifferentiated state. Time effect (differentiation) is responsible for the majority of the variability in global gene expression. PC1, first principal component; PC2, second principal component. (B) Supervised heat map of samples across the top 1,000 genes differentially expressed with differentiation (time effect) in ES and iPS cell samples. Two-way ANOVA was used to calculate the top 1,000 probe sets, ranked by FDR-adjusted P value. (C) Venn diagram of the overlap between the genetic programs of in vivo DE from the E8.25 embryonic DE and putative DE derived from ES and iPS cells. The top 2,715 genes differentially expressed (FDR < 0.001) between undifferentiated stem cells reminiscent of the blastocyst inner cell mass and E8.25 embryonic DE are shown compared with the top 1,000 genes representing in vitro ES/iPS cell–derived DE (time effect) shown in B. The schematic (top) demonstrates the comparison algorithm used for each statistical analysis to calculate the 2 indicated gene kinetic signatures. (D) Unsupervised clustering of the 18 in vitro samples shown in A and B across the 2,715 embryonic DE gene signature list from the E8.25 embryo. Unsupervised clustering indicates similar transcriptome changes in ES and iPS cells with in vitro differentiation.

