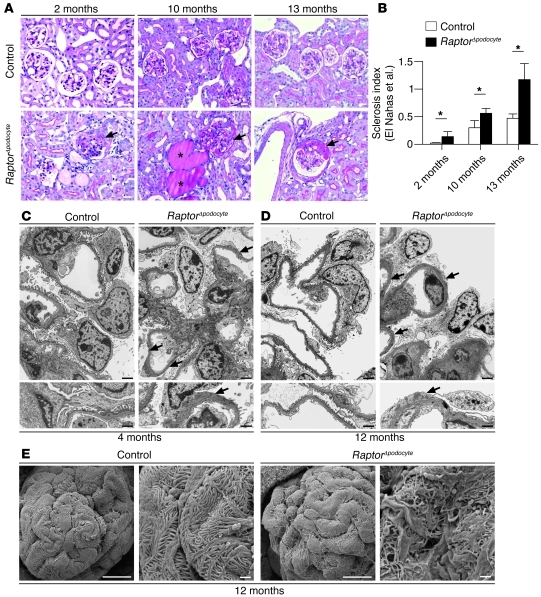
Figure 2. Podocyte-specific deletion of the mTORC1 complex results in progressive glomerulosclerosis.
(A and B) RaptorΔpodocyte mice developed progressive glomerulosclerosis between 2 and 12 months of age. Asterisks in photographs indicate proteinaceous casts in dilated tubules. Arrows indicate glomerulosclerosis with synechia formation (n = 4 mice each; *P < 0.05). Data are expressed as the mean ± SEM. (C and D) TEM analyses identified foot process effacement (arrows) at 4 and 12 months of age. (E) SEM analysis of foot processes at 12 months of age. Scale bars: 20 μm (A); 2 μm (C and D, upper panel); 1 μm (C and D, lower panel); 10 μm (E, first and third scanning electron micrograph); 1 μm (E, second and fourth scanning electron micrograph).

