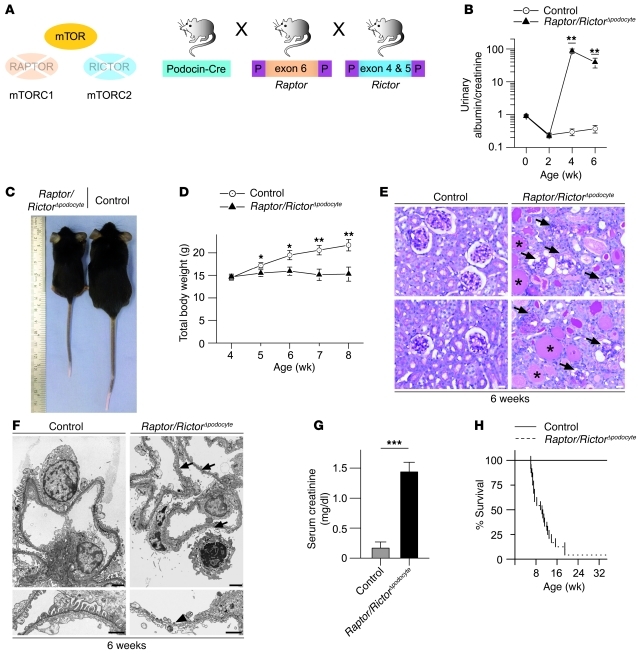
Figure 5. Synergistic action of mTORC1 and mTORC2 complexes are required for glomerular homeostasis.
(A) Schematic illustration of the generation of podocyte-specific Raptor- and Rictor-deficient mice (Raptor/RictorΔpodocyte) to interrupt mTORC1 and mTORC2 signaling. (B) Raptor/RictorΔpodocyte developed an early onset massive albuminuria (n = 7 control and n = 6 Raptor/RictorΔpodocyte mice; **P < 0.01). (C and D) Raptor/RictorΔpodocyte mice exhibited significant growth retardation after 5 weeks of age (n = 8 control and n = 6 Raptor/RictorΔpodocyte mice; *P < 0.05, **P < 0.01). (E) Histological analyses displayed glomerulosclerotic changes with circumferential synechia, crescent formation, vacuolization of podocytes, sometimes complete glomerular obsolescence, and proteinaceous casts in dilated distal tubules. Arrows indicate sclerotic glomeruli; asterisks indicate proteinaceous casts. (F) Raptor/RictorΔpodocyte mice showed global foot process effacement or loss of foot processes with denudation of the basement membrane in ultrastructural analyses (arrows depict foot process effacement; arrowhead indicates loss of foot processes). (G) Raptor/RictorΔpodocyte mice developed renal failure with increased serum creatinine (n = 9 control and n = 5 Raptor/RictorΔpodocyte mice; ***P < 0.0001) and (H) died between 6 and 12 weeks of age. Scale bars: 20 μm (E); 2 μm (F, upper panel); 1 μm (F, lower panel). Data are expressed as the mean ± SEM.

