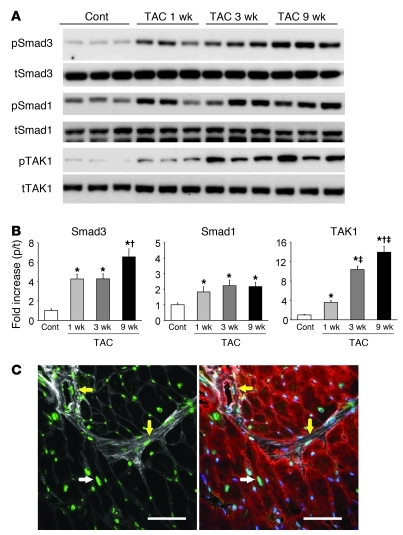
Figure 1. Smad3 and TAK1 phosphorylation are increased in chronic phases of pressure overload.
(A) Representative Western blot for phosphorylated (p-) and total (t-) Smad3, Smad1, and TAK1 using LV tissue lysates after TAC. Cont, sham control. (B) Summary data for immunoblot. n = 4–6. *P < 0.05 vs. sham; †P < 0.05 vs. 3-week TAC; ‡P < 0.05 vs. 1-week TAC. (C) Immunostaining for phospho-Smad3 (green) in 9-week TAC LV myocardium. Blue, DAPI (nucleic acid); red, sarcomeric α-actinin (myocytes); white, WGA (membrane/extracellular matrix). White arrows, cardiomyocyte Smad3 activation; yellow arrows, nonmyocyte (e.g., fibroblast, vascular SMC) Smad3 activation. Scale bars: 50 μm.

