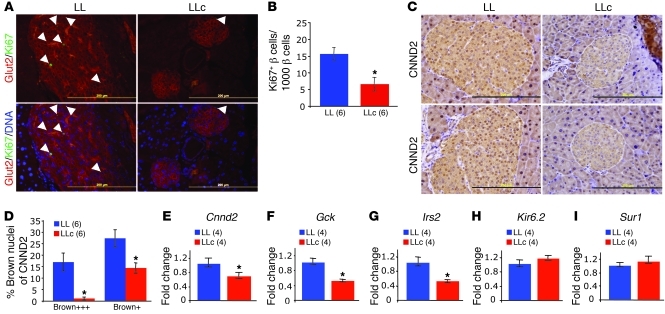
Figure 3. Reduced β cell proliferation in obese βGHRKO mice.
(A) Immunofluorecence analysis of Ki67 in pancreatic sections. Ki67 is stained green, GLUT2 red, and the nucleus blue. (B) Quantification of Ki67-positive cells per 1,000 cells based on 20–25 islets in each group. (C) Immunohistochemical staining for cyclin D2 in pancreas sections from obese control and βGHRKO mice. Top and bottom rows each show representative images of the two groups. (D) Quantification of nuclear cyclin D2 staining, with determination of strong nuclear staining (Brown+++) and weak nuclear staining (Brown+). (E–I) Gene expression of cyclin D2 (Cnnd2), Gck, Irs2, Kir6.2, and Sur1 in isolated islets from obese control and β-GHRKO mice. Scale bars: 200 μm (A and C). Numbers in parentheses indicate sample size. *P < 0.05.

