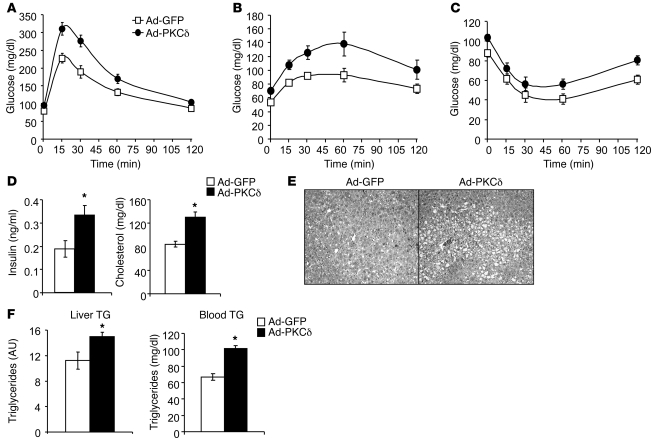
Figure 5. Mice with liver-specific overexpression of PKCδ develop features of the metabolic syndrome.
(A) GTT in mice overexpressing GFP or PKCδ in the liver (n = 13 per group). (B) PTT in mice overexpressing GFP or PKCδ in the liver (n = 9 per group). (C) ITT in mice overexpressing GFP or PKCδ in the liver (n = 19 per group). (D) Serum insulin and cholesterol levels in mice overexpressing GFP or PKCδ in the liver. (E) Histological pictures of H&E-stained liver sections from mice overexpressing GFP or PKCδ in the liver (original magnification, ×200). (F) Triglyceride levels in blood and liver of 2-hour-fasted mice overexpressing GFP or PKCδ in the liver (n = 8 per group, *P < 0.01).

