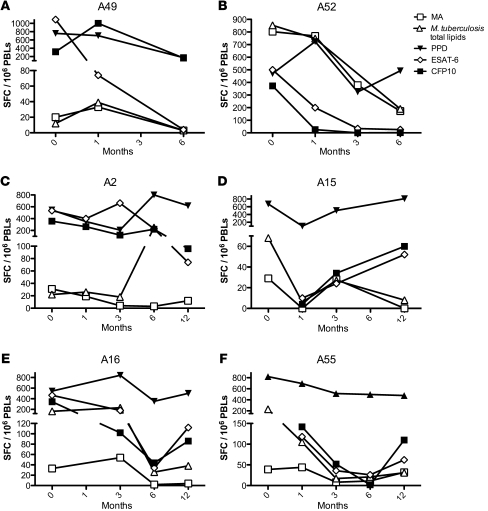
Figure 3. Longitudinal study of T cell responses to M. tuberculosis antigens in TB patients during treatment.
IFN-γ production from 6 TB patients in response to MA, M. tuberculosis total lipids, PPD, ESAT-6, and CFP10 was serially monitored from diagnosis up to 6 months after diagnosis for 2 patients (A and B; patients A49 and A52) and for 12 months after diagnosis for 4 patients (C–F; patients A2, A15, A16, and A55) using IFN-γ ELISpot.

