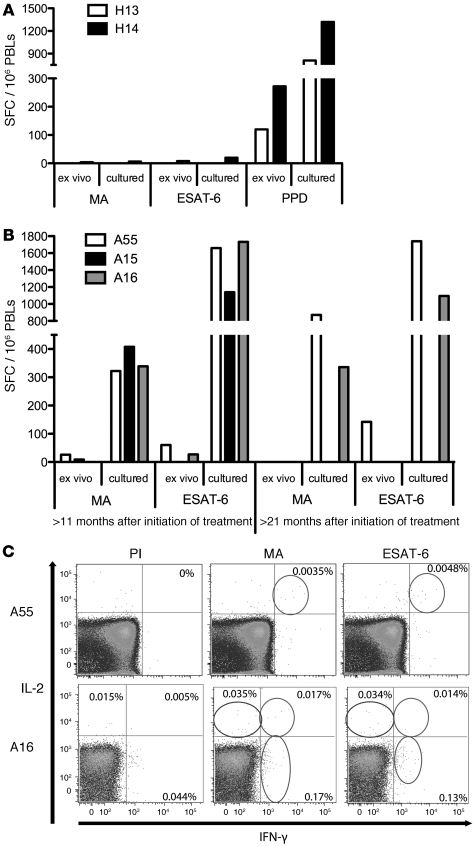
Figure 7. Expansion of MA-specific T cell responses from the blood of TB patients more than 6 months after curative treatment.
PBLs from (A) 2 healthy donors (H13, H14) and (B) 3 TB patients (A15, A16, and A55 bled 27, 21, and 11 months after initiation of treatment, respectively, and 10 months later) were incubated for 14 days in the presence of blood monocyte–derived DCs pulsed with PI, MA, ESAT-6, or PPD. Cultured T cells were then harvested and restimulated with blood-derived DCs pulsed with their respective antigens, and results analyzed by ELISpot. (C) Direct ex vivo staining of uncultured PBLs from patients A55 and A16 (21 and 37 months after treatment initiation, respectively). PBLs were incubated in the presence of monocyte-derived DCs pulsed with PI, MA, or ESAT-6. IFN-γ– and IL-2–producing T cells were enriched through magnetic separation and stained with anti-CD3, anti-CD4, anti-CD8, anti-CCR7, and anti-CD45RA. Stained cells were analyzed by flow cytometry. Circles represent positive dual IFN-γ/IL-2–secreting T cells (top right quadrants); positive IL-2–only–secreting T cells (top left quadrants); and positive IFN-γ–only–secreting T cells (bottom right quadrants). Percentages of live CD3+ cells are shown in each quadrant in which a response was present.

