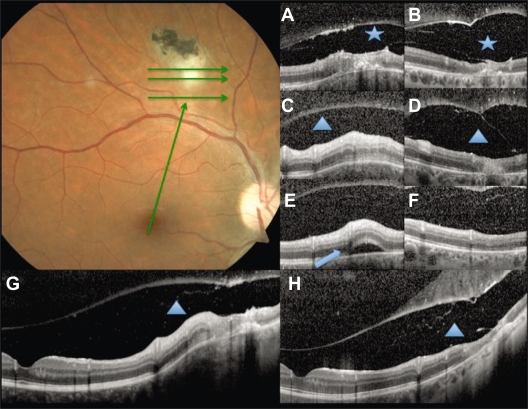
Figure 3.
Baseline fundus photography. Green arrows show the scan acquisition protocol used by spectral domain optical coherence tomography. A, C, and E are from the volume scans at baseline, and G, a linear scan from the fovea to the lesion. B, D, F, and H correspond to the same points at follow up. Vitreoschisis (asterisk) can be noticed at baseline A) and after 6 weeks B). Note the expanded vitreous detachment at follow up. Subretinal fluid at the lesion site (arrowhead) is seen at baseline E) with resolution after 6 weeks F). The triangle shows the retinochoroidal lesion increased thickness at baseline (C, G) and atrophy at follow up (D, H).

