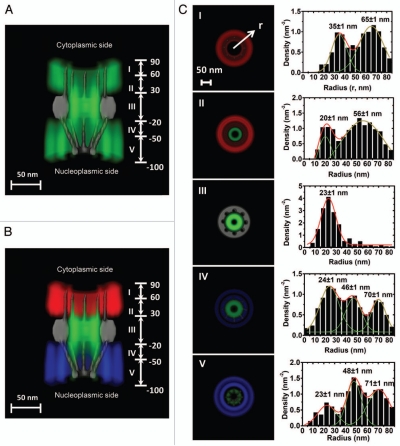
Figure 3.
A 3D spatial-density map of interaction sites between Imp β1 and the FG-Nups. (A) A complete 3D spatial-density map of interaction sites between Imp β1 and the FG-Nups. Cut-away view of the 3D spatial density map of Imp β1 (green cloud and brighter color indicates higher density) superimposed on the NPC architecture (grey). Five regions with distinct spatial location clusters for Imp β1 are marked from I to V. Numbers denote the distance from the central plane of the NPC in nanometers. (B) The same density map as in (A) is shown in different colored regions (red for the cytoplasm, blue for the nucleoplasm and green for the central pore). (C) Histograms of averaged spatial densities along the radii (r) at the cross-section of NPC in the range I to V. Major peaks were obtained by Gaussian fittings (green and red lines). Bin size: 5 nm.

