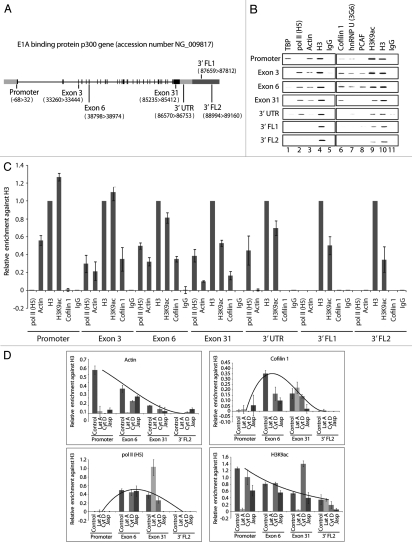
Figure 2.
Cofilin-1 selectively occupies gene coding region. (A) The E1A binding protein p300 (EP300) gene. (B) ChIP assays with the indicated antibodies. Co-precipitated DNA was analyzed by PCR with primers for promoter, proximal and distal exons, 3′UTR and gene flanking regions (FL). (C) Quantification of relative occupancies at EP300 gene promoter, proximal and distal exons, 3′UTR, 3′ FL1 and FL2 of phosphorylated pol II (H5), actin, H3, H3K9ac, cofilin 1. The bar diagrams show relative amounts of gene promoter, exon 3, exon 6, exon 31, 3′UTR, FL1 and FL2 precipitated with antibodies against the above proteins and with a non-specific rabbit IgG used as control in the ChIP assay in part B. Calculations were made with respect to H3. Values were obtained by densitometric calculations of PCR products resolved by agarose gel electrophoresis (and revealed by ethidium bromide staining) in at least five independent experiments. Error bars represent standard deviations. (D) Cofilin-1 gene occupancy is sensitive to G-actin depletion. Densitometric quantification of relative occupancies determined by ChIP experiments on chromatin isolated from untreated cells or cells treated with the indicated drugs. Bars diagrams represent average values calculated from analysis of promoter, coding regions (exon 6 and exon 31) and 3′ FL2 over five independent experiments. All values are normalized against the signals obtained with an H3 antibody. See also supplemental information.

