
Figure 2. LNO2 induces HO-1 in cultured cells and in rat lungs in vivo.
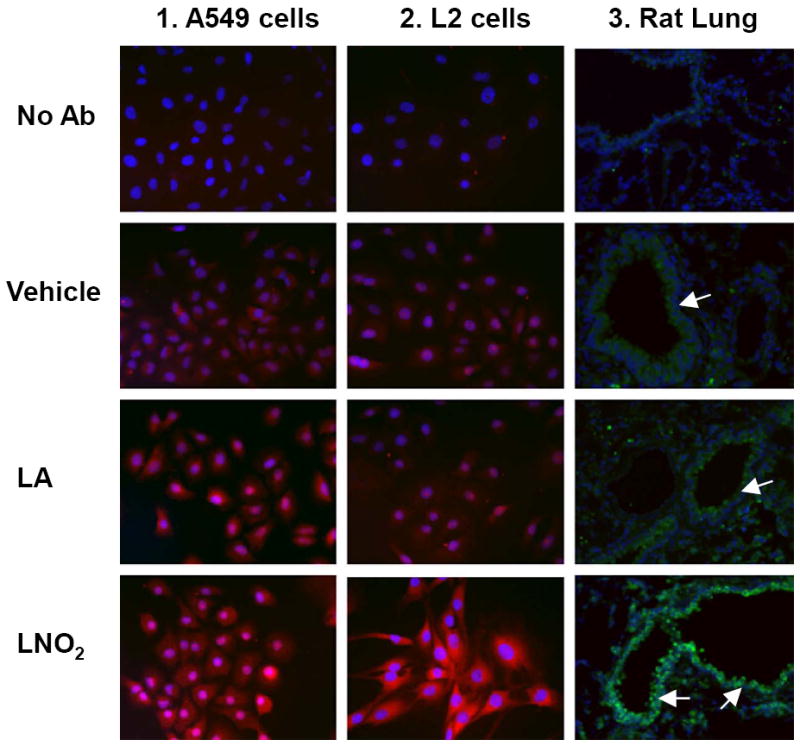
Human pulmonary epithelial cells (A549 cells) and rat pulmonary epithelial cells (L2 cells) were treated with LNO2 (5 and 50 μM). HO-1 protein was visualized by Alexa Fluor 594 (red) or Alexa Fluor 488 (green) with a fluorescence microscope, 40X objective. Nuclei were counterstained blue with DAPI (blue). Treatment groups for Panels 1 and 2 correspond to no primary antibody, vehicle control (MeOH), linoleic acid (LA), and LNO2. In Panel C, rats were injected with 2.6 mg/kg i.p. of LNO2 twice daily for 20 days. Treatment groups correspond to no primary antibody, vehicle, LA and LNO2. Airways are marked with arrows.