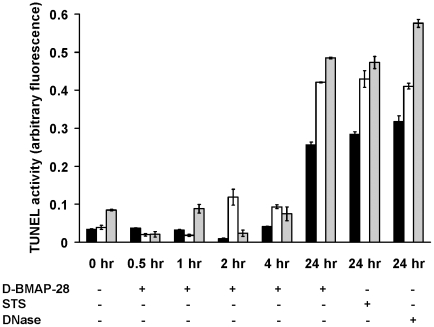
Figure 5. Induction of late apoptosis events in L. major strains after incubation with D-BMAP-28.
Quantitative colorimetric analysis of DNA degradation in L. major wt (black bars), L. major ko (clear bars) and L. major ko+ (grey bars) after treatment with 2 µM D-BMAP-28 for 0.5 hr, 1 hr, 2 hr, 4 hr and 24 hr using the TUNEL assay. Cells treated with 16 µM staurosporine (STS) as well as DNase treated cell lysates were used as positive controls. Each bar represents the mean of three replicates; error bar represents the standard error of the mean.

