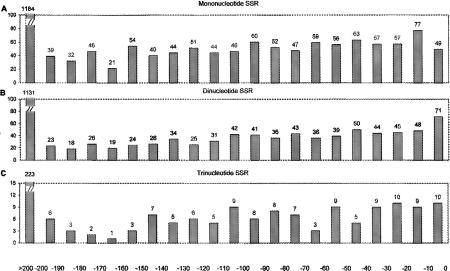
Figure 2.
Histograms showing frequencies of fine locations of SSR tracts in the entire E. coli genome relative to start of translation for particular ORFs downstream of the SSR tracts for mononucleotide SSRs >6 bp (A), dinucleotide SSRs >6 bp (B), and trinucleotide SSRs >9 bp (C). The horizontal axis shows position relative to the ATG codon marking the start of translation.

