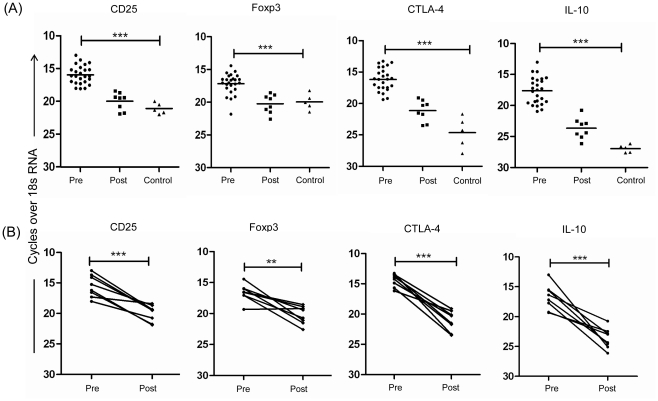
Figure 1. Ex vivo analysis of mRNA expression of Treg markers and IL-10 in PKDL.
Relative mRNA levels of CD25, Foxp3, CTLA-4 and IL-10 in lesion tissues of PKDL patients determined by real time polymerase chain reaction at pretreatment (n = 25) or post treatment (n = 8), or control tissues (n = 5) (A) and in paired samples (n = 8) shown separately (B). **P<0.01, and ***P<0.001.

