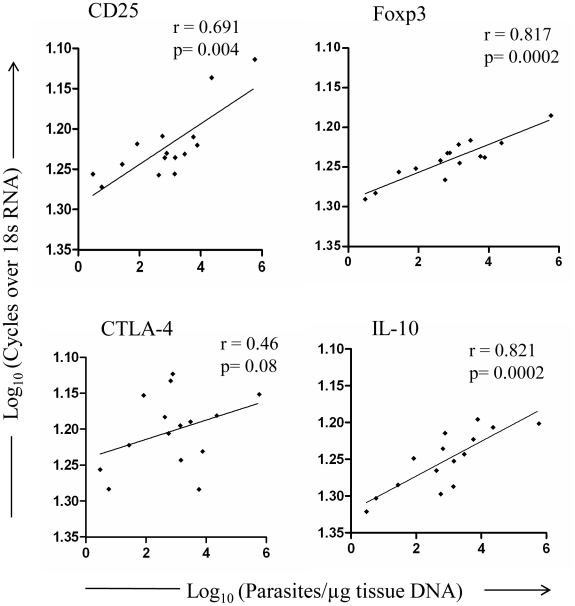
Figure 2. Correlation of mRNA expression of Treg markers and IL-10 with parasite load in PKDL.
Relative mRNA levels of Treg markers and IL-10 with respect to parasite load within lesion tissues of PKDL patients (n = 15). Plot was created using logarithmic values for cycles over 18sRNA and parasite load. Correlation was calculated using Spearman/Pearson correlation test. Diagonal line represents linear regression.

