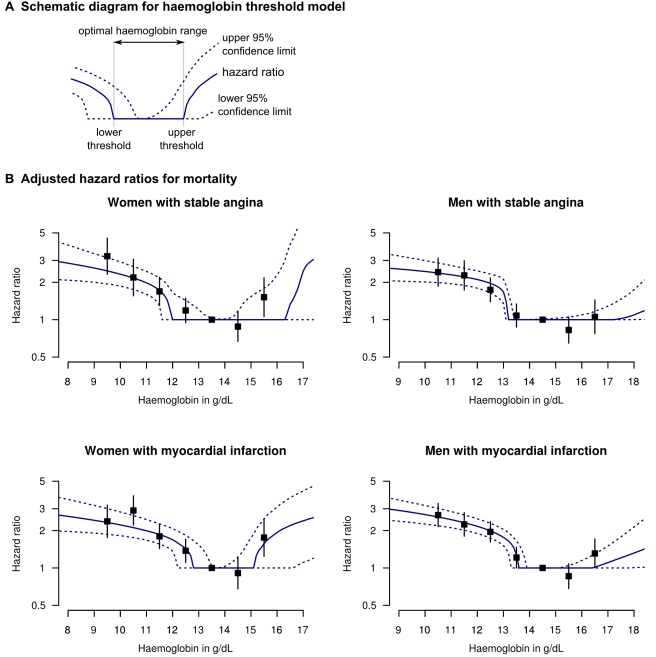
Figure 1. Adjusted HRs for death for patients with stable angina or MI, by haemoglobin concentration.
(A) Legend and diagram for haemoglobin threshold model; (B) HRs for death by gender and coronary diagnosis (new onset stable angina or first MI), adjusted for age, eGFR, systolic BP, total cholesterol, family history, diabetes, smoking, and comorbidity (Charlson index). The black squares denote HRs from the stratified haemoglobin model (with 95% CIs).

