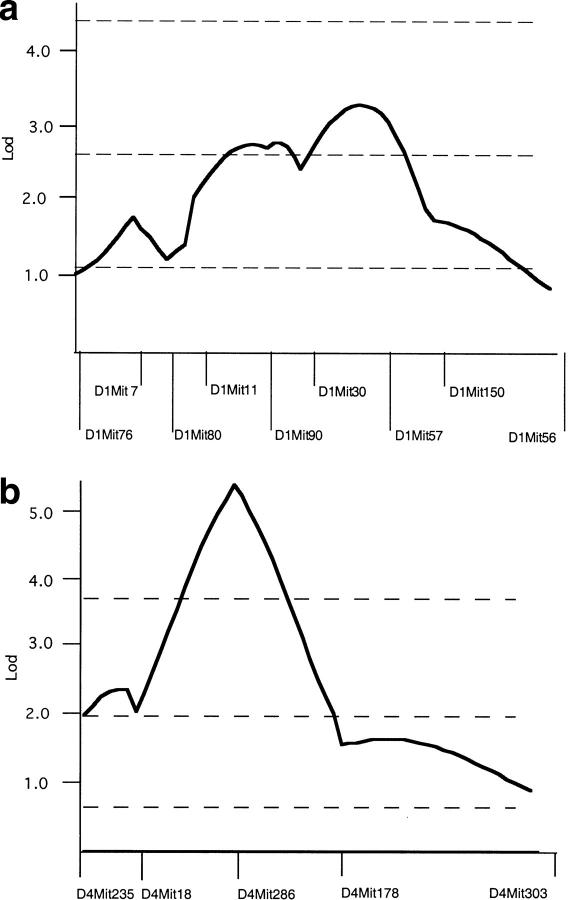
Figure 3.
QTL analysis. (a) MapManager QT was used to analyze chromosome 1 genotype and trait data from affected F2 progeny of a cross between C57BL/6J jck/+ and DBA/2J jck/+ mice. (b) MapManager QT was used to analyze chromosome 4 genotype and trait data from affected F2 progeny of a cross between B6 jck/jck and D2.B6 chr1 congenic mice. For both analyses, a permutation test was used to calculate the threshold levels indicated for suggestive, significant, and highly significant linkage (dotted lines).

