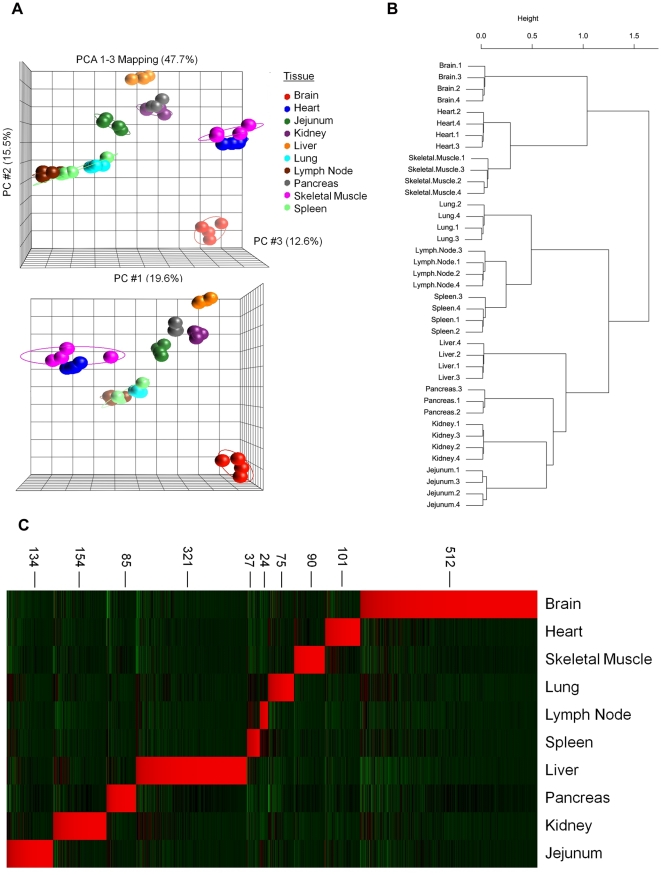
Figure 1. Principle component analysis and hierarchical clustering define relationships between canine normal tissues.
mRNA expression for 39 samples from ten pathologically normal canine tissues were analyzed using the Affymetrix Canine Version 2.0 GeneChip®. Probesets differentially expressed in at least one tissue (as described in the Methods) were included in the analysis (23,070 probesets corresponding to 10,878 unique gene symbols). A. Samples were analyzed by principle component analysis (PCA) to characterize relationships between biological replicates for each tissue. Each sphere represents an individual sample, colored by tissue and ellipses correspond to two standard deviations of the tissue group mean. B. Hierarchical clustering of samples was conducted with distances calculated using Pearson correlation metrics and clusters joined using Ward linkage. Bootstrap re-sampling was conducted (1,000 iterations) in order to determine cluster stability. C. Heatmap demonstrating tissue selective gene expression. Following ANOVA to determine differential expression based on tissue type, results were filtered based on FDR = 0.001 as well as expression thresholds of greater than 10-fold expression over the mean of all other tissues and no greater than 3-fold over the mean in any other tissue. This final list of tissue selective probesets was rank ordered according to fold-expression with sample order determined by the previous bootstrapped hierarchical clustering. Red indicates upregulated and green represents downregulated relative to the mean expression in all tissues. Numbers next to the heatmap indicate the number of tissue selective probesets in a cluster.

