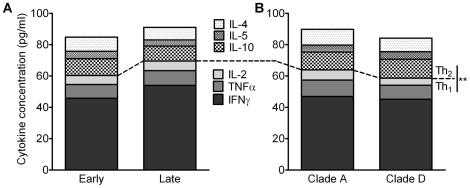
Figure 3. Total cytokine concentrations in study participants.
Bar graphs represent cytokines concentrations (pg/ml) as a proportion of the total concentration of Th1 and Th2 cytokines measured. These have been stratified by HIV-1 disease stage (A) or HIV-1 clade (B) with shaded and patterned areas corresponding to Th1 and Th2 cytokines respectively. ** = p<0.0001 (Mann Whitney test) for total Th1 vs Th2 cytokines when compared across all HIV positive study participants (n = 50).

